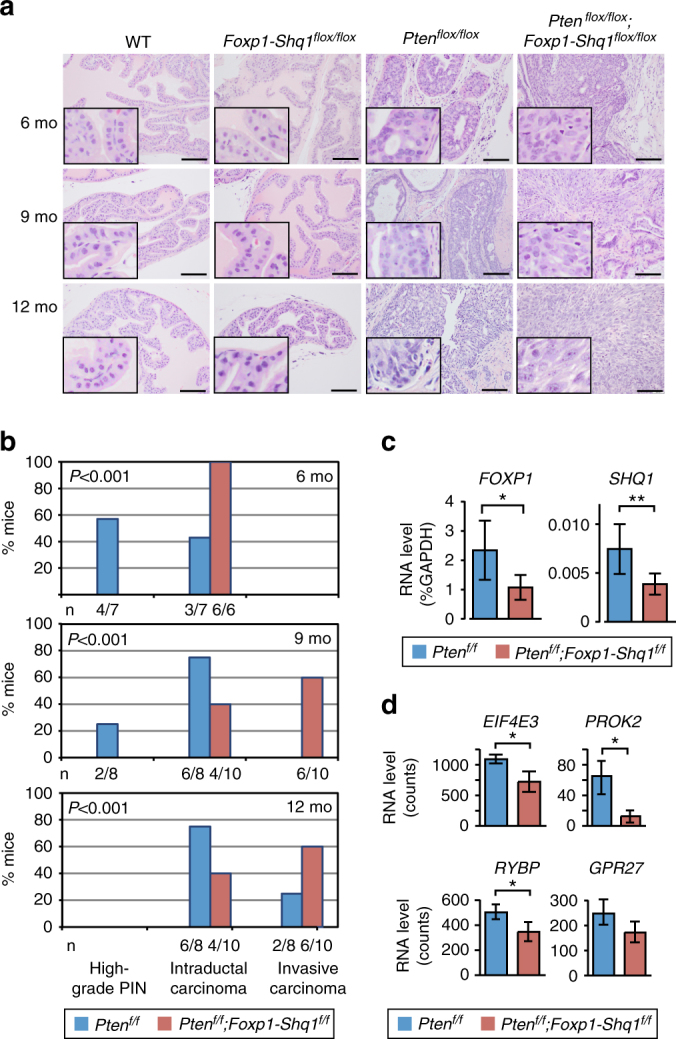
Fig. 2.

Foxp1-Shq1 loss cooperates with Pten loss in prostate tumorigenesis. a Comparison of prostate histology (H&E) in wild-type, Foxp1-Shq1 flox/flox, Pten flox/flox, and Foxp1-Shq1 flox/flox ;Pten flox/flox mice with Pb-Cre at 6, 9, and 12 months. Scale bars, 50 μm. Insets show 4× magnification of a portion of the full panel. b Histogram of histology in Pten flox/flox (blue; total n = 23; 6 mo, n = 7; 9 mo, n = 8; 12 mo, n = 8) and Foxp1-Shq1 flox/flox ;Pten flox/flox (red; total n = 28; 6 mo, n = 8; 9 mo, n = 10; 12 mo, n = 10) mouse prostates at 6, 9, and 12 months. The number, n, mice is listed as a fraction of the total n per genotype per time point below each bar. P, Chi-square significance value. c Quantification of Foxp1 and Shq1 RNA level by quantitative PCR normalized to GAPDH in Pten flox/flox and Foxp1-Shq1 flox/flox ;Pten flox/flox 12-month mouse prostates. Error bars, SD. Significance of association, t-test, *P < 0.05; **P < 0.01. d Quantification of the RNA level of Eif4e3, Gpr27, Prok2, and Rybp genes intergenic to Foxp1 and Shq1, by RNA sequencing in Pten flox/flox and Foxp1-Shq1 flox/flox ;Pten flox/flox 12-month mouse prostates. Normalized counts are shown. Significance of association, t-test, *P < 0.05. Error bars, SD
