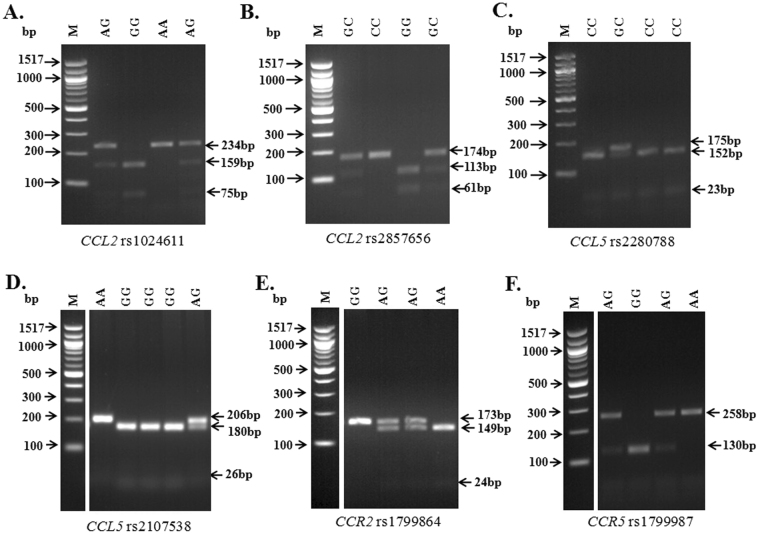
Figure 1.
Genotyping of all the studied SNPs in agarose gel electrophoresis. (A) represents CCL2 rs1024611A/G where AA homozygote was identified by a single 234 bp fragment, GG homozygote was characterized by 159 bp and 75 bp while AG heterozygote was identified by 234 bp, 159 bp and 75 bp fragments; (B) represents CCL2 rs2857656G/C where CC genotype was identified by uncut 174 bp band, GG was identified by two fragments of 113 and 61 while CG heterozygote was characterized by 174 bp, 113 bp and 61 bp; (C) represents CCL5 rs2280788C/G where CC genotype was identified by 152 bp and 23 bp fragments while for GC heterozygote, three bands at 175 bp, 152 bp and 23 bp was observed; (D) represents CCL5 rs2107538G/A where an uncut single band of 206 bp corresponded to AA homozygote, 180 bp and 26 bp corresponded to GG homozygote while presence of three bands at 206 bp, 180 bp and 26 bp was identified as AG heterozygote; (E) denotes CCR2 rs1799864A/G where an uncut single band of 173 bp was identified as GG, 149 bp and 24 bp was characterized by AA homozygote while AG heterozygote was identified by 173 bp, 149 bp and 24 bp fragments; (F) represents CCR5 rs1799987A/G where AA genotype was characterized by 258 bp fragment, GG genotype was identified by 130 bp fragment while for AG heterozygote bands at 258 bp and 130 bp was observed. Images (D), (E) and (F) are vertically sliced images of juxtaposed lanes that were non-adjacent to the molecular marker and are delineated with white space. Gel images shown here are cropped images and full length gels are presented in Supplementary Fig. S7. Abbreviations: M, molecular size marker; bp, base pairs.

