Fig. 2.
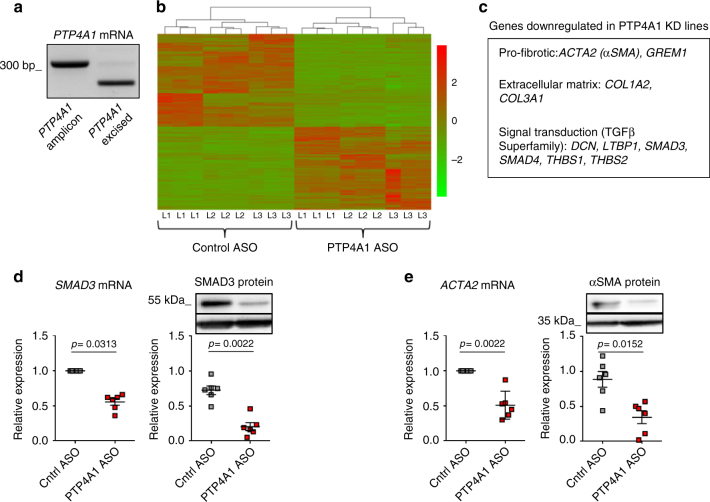
Silencing of PTP4A1 downregulates pro-fibrotic genes in NHDF. a Agarose gel with RT-PCR of PTP4A1 mRNA from NHDF lines treated with control ASO (left lane) or with PTP4A1 ASO (right lane). b The heat map shows gene expression levels of three different NHDF lines (L1–3) treated with control ASO or PTP4A1 ASO. NGS was performed in triplicate for each NHDF line. c List of human pro-fibrotic genes downregulated in PTP4A1 KD NHDF lines, after DESeq analysis. d, e Left graphs show mean ± SEM of SMAD3 and ACTA2 mRNA expression measured in six different NHDF lines treated with PTP4A1 ASO and normalized to same lines treated with control ASO. Right graphs show mean ± SEM of densitometric scan expression plus representative immunoblotting for SMAD3 and αSMA (upper bands) normalized to GAPDH (lower bands) in six different NHDF lines treated with control ASO or PTP4A1 ASO. Wilcoxon test (d, e left) or Mann–Whitney test (d, e right)

