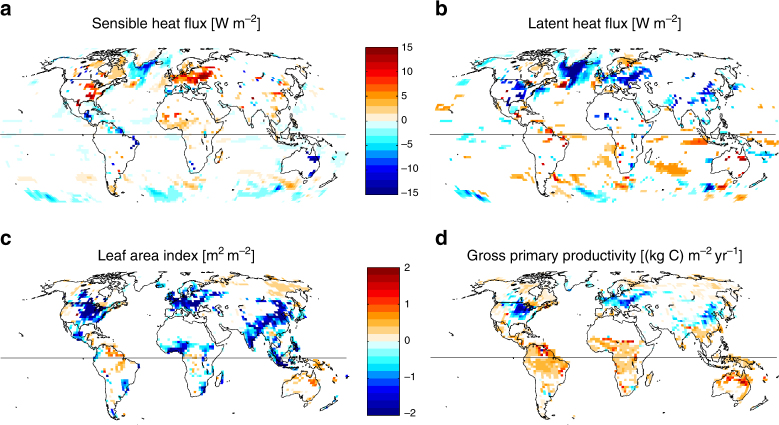
Fig. 3.
Mean model response to anthropogenic LULCC. Mean differences between the AllHist and the PotVeg simulations for June–August (JJA) in the northern hemisphere and for December–February (DJF) for the southern hemisphere, averaged over the years 1981–2005 in two ensemble members for each experiment. a Sensible heat flux; b latent heat flux; c leaf area index; and d gross primary productivity. Differences shown pass a modified t-test at the 90% significance level

