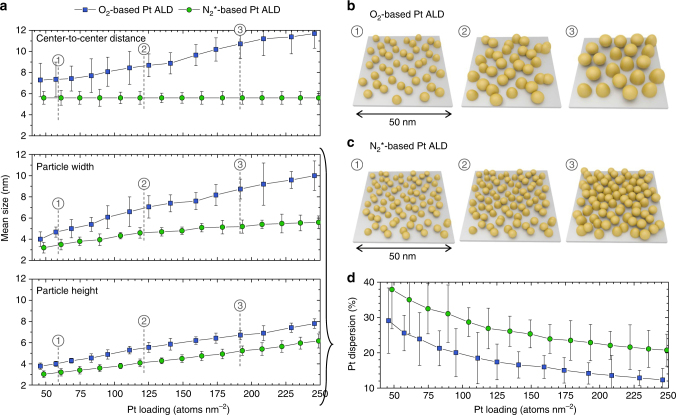
Fig. 3.
Morphological evolution of Pt nanoparticles during ALD. a In situ data, obtained from GISAXS and XRF, on mean center-to-center distance (top), particle width (middle) and particle height (bottom) against Pt loading for O2-based Pt ALD (blue squares) and N2 *-based Pt ALD (green circles). The error bars represent the uncertainties of the obtained values. These uncertainties were estimated based on a quantitative comparison of experimental and calculated 1D vertical (for the particle height) and horizontal (for the particle width and center-to-center distance) GISAXS line profiles. The sum of squared residuals (SSR) was calculated for varying input values for one of the parameters (while the other parameters were kept constant). The presented uncertainties correspond to an increase in the SSR of ca. 50%. All details about the calculations may be found in Supplementary Note 3. b, c Schematic representation of the GISAXS results for Pt loadings of (1) ~60, (2) ~120, and (3) ~190 Pt atoms per nm2 obtained using O2-based Pt ALD (b) and N2 *-based Pt ALD (c). d Pt dispersion, i.e., fraction of accessible Pt atoms, calculated from the particle dimensions and shape, as obtained from GISAXS, against Pt loading for O2-based Pt ALD (blue squares) and N2 *-based Pt ALD (green circles). The error bars were derived from the uncertainties of the particle dimensions and error propagation theory

