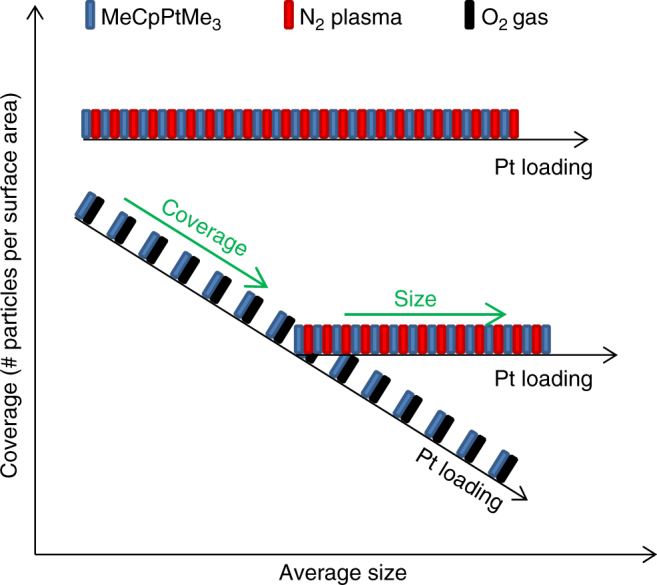
Fig. 4.

Morphological tuning of Pt nanoparticles using ALD. ALD recipe scheme showing the evolution of Pt nanoparticle coverage and size during the application of O2-based and N2 *-based Pt ALD cycles. The blue, red, and black rectangles represent exposures to the Pt precursor, N2 plasma and O2 gas, respectively. For the O2-based Pt ALD process (alternating blue and black rectangles), the coverage decreases and the average size increases with increasing number of ALD cycles. For the N2 *-based Pt ALD process (alternating blue and red rectangles), the coverage remains constant and the average size increases with increasing number of ALD cycles. By combining both processes, both the particle coverage and particle size can be tuned as indicated by the green arrows
