Fig. 7.
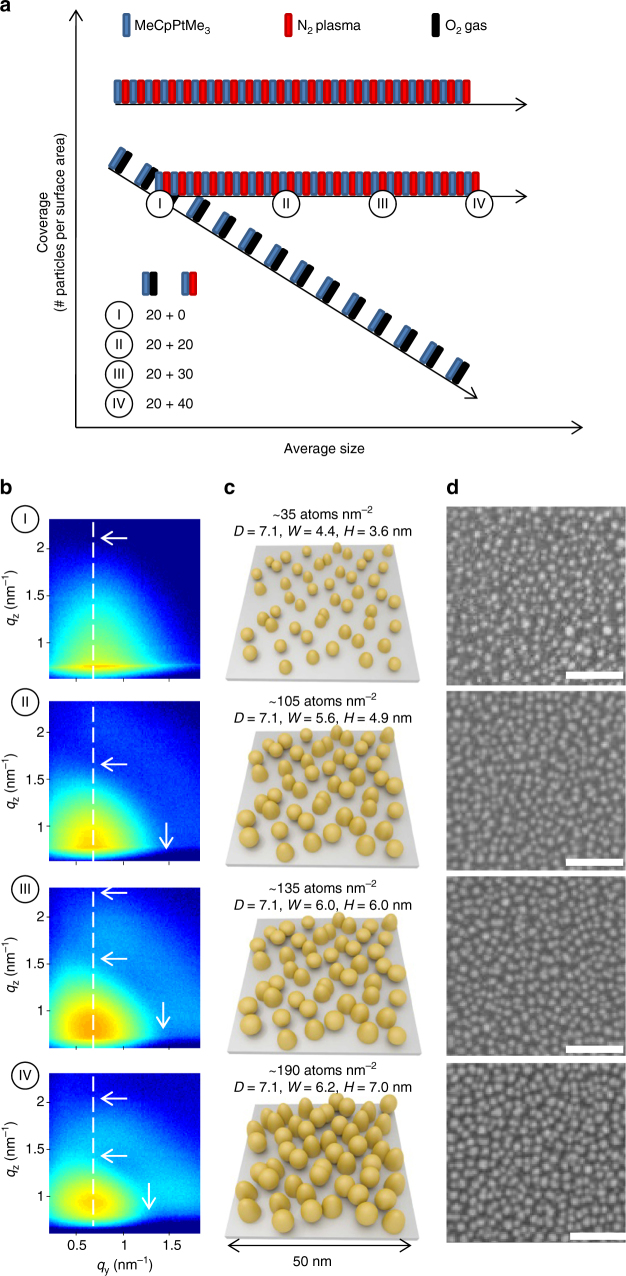
Precise control of size of Pt nanoparticles using ALD. Tuning the particle size at a fixed particle coverage by combining 20 O2-based Pt ALD cycles with 0 (sample I), 20 (sample II), 30 (sample III), and 40 (sample IV) N2 *-based Pt ALD cycles. a ALD recipe scheme. For clarity, fewer than the real number of ALD cycles are schematically represented. b Experimental 2D GISAXS images. The dashed vertical lines indicate the q y-position of the main scattering lobe. The horizontal/vertical arrows indicate the minima along the q z/q y-direction. c Schematic representations of the GISAXS results. The Pt loading, mean center-to-center particle distance 〈D〉, average particle width 〈W〉, and average particle height 〈H〉 are indicated. d SEM images with 50 nm scale bars

