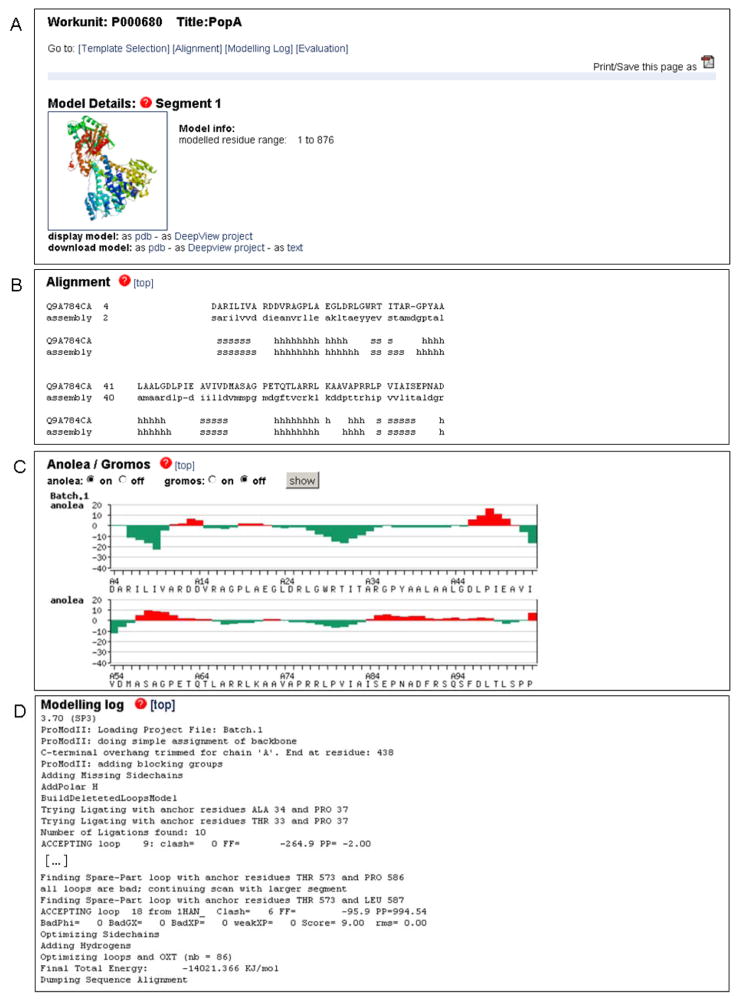
Fig. 3.
Typical representation SWISS-MODEL Workspace modeling results. In this example the C. crescentus PopA protein was modeled based on the structure of the paralog protein PleD (PDB ID 2wb4) using the Project Mode of the server. (A) The comparative model for PopA can be downloaded as PDB or DeepView project file. The model can be visualized directly on the web-page by clinking on the ribbon plot which will launch a java based visualization tool. In the Automated Mode, additional information about the template and the statistical significance of the target-template alignment would be shown in this section. (B) Details of the target-template alignment are provided together with the secondary structure elements assignments. (C) Anolea (44) and Gromos energy (50) plots provide residue based quality estimates of the model. Regions with positive energy values (red bars) indicate unfavorable interactions and regions of likely modeling errors. (D) Details about the modeling procedure are available at the end of the results. In the Automated Mode an additional section regarding the template selection step will be shown.

