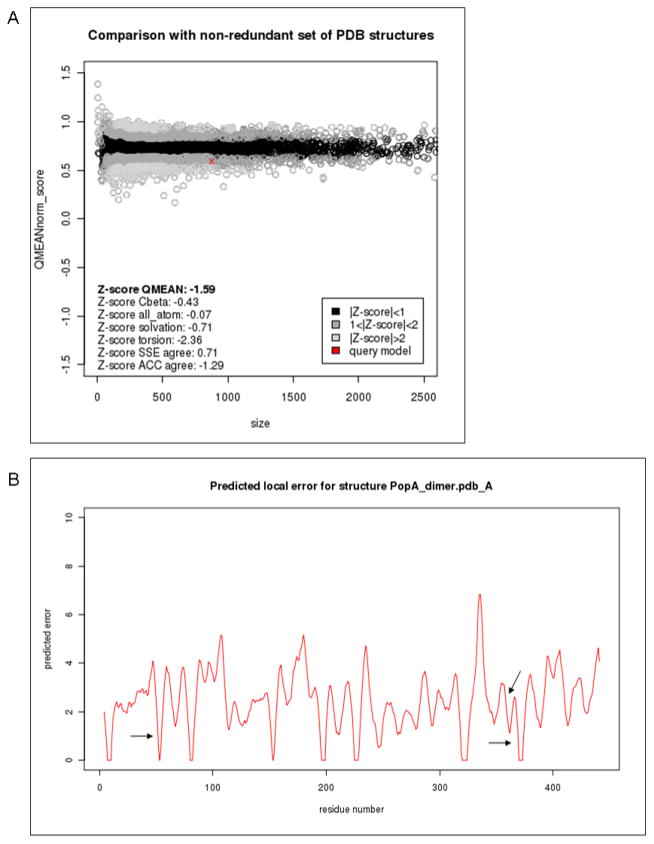
Fig. 4.
Examples of SWISS-MODEL Workspace model quality estimation plots calculated using QMEAN. (A) The global estimated energy of the PopA model (red cross) is compared to the QMEAN energy estimates (51, 92) for a non-redundant set of high-quality experimental protein crystal structures of similar length, and their deviation from the expected distributions is represented as Z-scores. The QMEAN quality estimate for PopA lies within the expected range for models of this type and is comparable to a medium resolution experimental structure. (B) Local (per-residue) plot of the QMEAN predicted errors for PopA. QMEAN scores for important functional sites (Phosphorilation- Activation- and Inhibitory- sites respectively) are depicted as arrows, indicating that the local environment of these regions is not located in problematic segments of the predicted structure.

