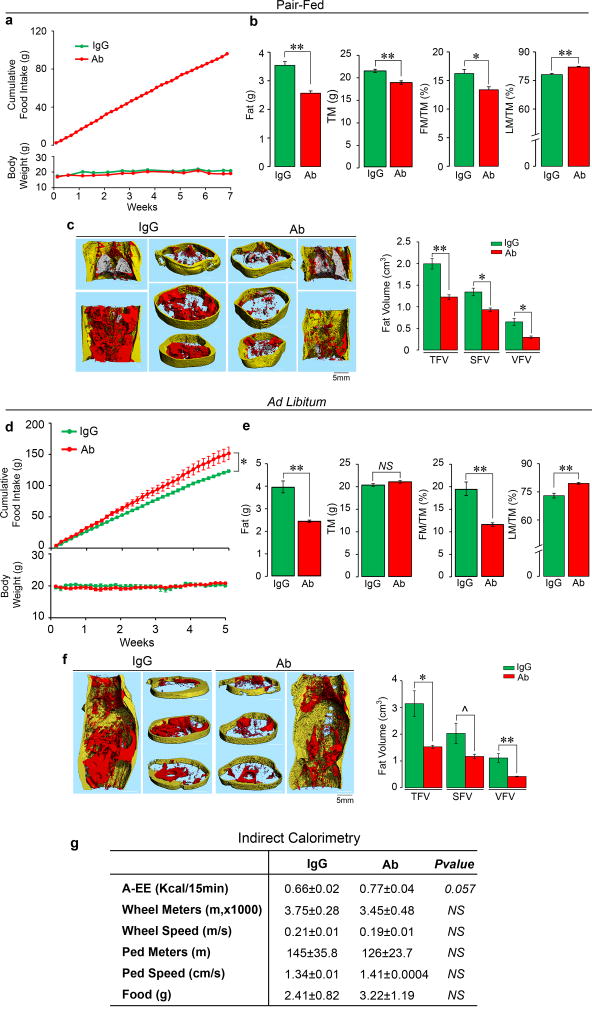
Extended Data Figure 6. Fsh Ab Reduces Body Fat in Mice Fed on Normal Chow.
Three-month-old C56BL/6J female mice were either pair-fed (a–c) or fed ad libitum (d–f) with normal chow and injected with Fsh Ab or IgG (100 µg/mouse/day) for 7 and 5 weeks, respectively. For pair-feeding, the amount of chow consumed ad libitum by the IgG group was given to the Ab-treated group. For ad libitum feeding, the Ab-treated group was allowed ad libitum access to food and the same amount of chow was given to IgG group, with the left-over chow measured to determine food intake of the IgG group (see Methods). A significant increase in food intake by Ab-treated mice was noted in the ad libitum feeding protocol (d). Nonetheless, as with mice on a high-fat diet, in either feeding protocol (c.f. Fig. 1 and Extended Data Fig. 2), Ab caused a significant decrease in total mass (TM), fat mass (FM) and FM/TM and increase in lean mass/TM (LM/TM) on quantitative NMR (b) in mice that were pair fed. Body weight (a) was also reduced (see Excel Spreadsheet for P-values). However, while Ab-treated mice consumed significantly more chow compared to IgG-injected mice, they showed decrements in FM and FM/TM, but did not show a reduction in TM (e) or body weight (d) (also refer to Excel Spreadsheet for P-values). Micro-CT showed profound decreases in thoracoabdominal fat, visualized in representative coronal and transverse sections (red, visceral fat; yellow, subcutaneous fat), and upon quantitation of total (TFV), subcutaneous (SFV) and visceral fat volumes (VFV) (c, f) in both groups (n=4 or 5/group for a-f). Indirect calorimetry (metabolic cages) showing active EE (A-EE), running distance (Wheel Meters), running speed (Wheel Speed), walking distance (Ped Meters), walking speed (Ped Speed) and food intake (n=4/group) (g). Two-Tailed Student’s T-Test; *P≤0.05, **P≤0.01, ^P=0.069, or as shown.

