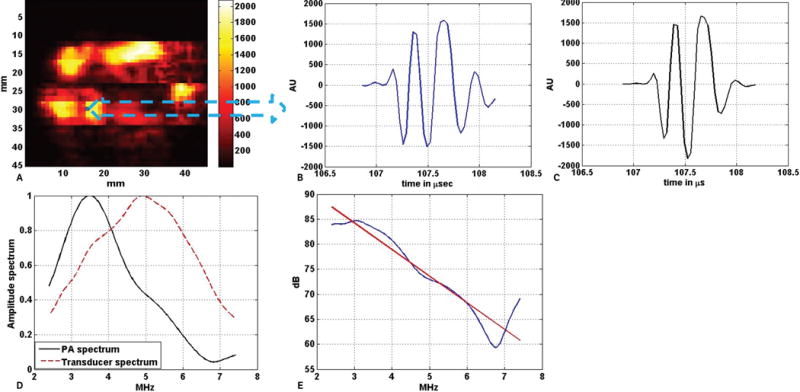
Figure 6.

Example of power spectrum analysis on a single photoacoustic A-line signal. A, C-scan photoacoustic image of the excised prostate specimen shown in Figure 5A. B, Photoacoustic A-line signal generated by the tissue corresponding to the blue pixel in A. C, Windowed photoacoustic signal: ie, the photoacoustic signal in B was multiplied with a Hamming window of the same length. D, Amplitude spectrum of the windowed photoacoustic (PA) A-line signal along with the 1-way amplitude spectrum of the transducer (both normalized) in the useable bandwidth region (2.4–7.4 MHz). E, Calibrated power spectrum fitted to the linear model. The red line in E is the best fit straight line to the power spectrum of the windowed photoacoustic A-line, which is shown by the blue line. AU indicates arbitrary unit.
