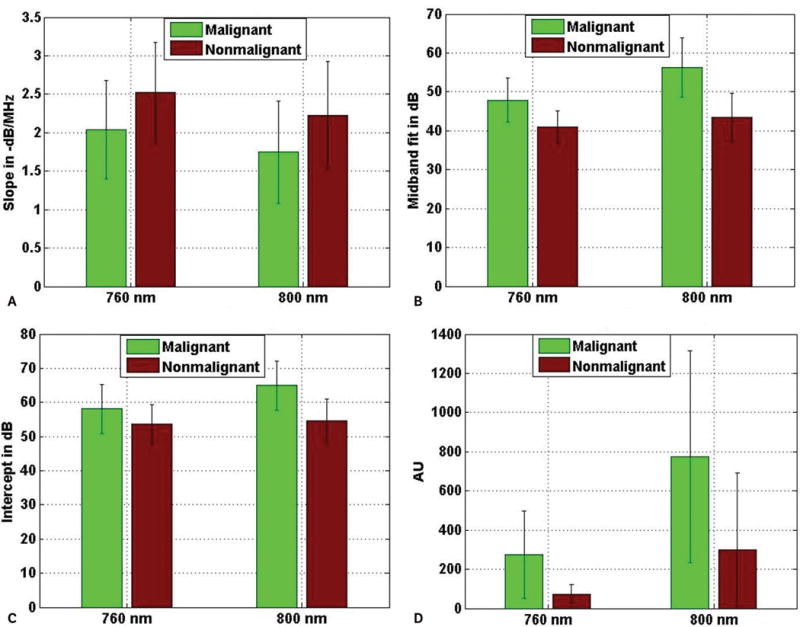
Figure 8.

Average values of slope (A), midband fit (B), intercept (C), and photoacoustic pixel (D) corresponding to different tissue types at 2 different wavelengths. The error bars are the standard deviations of the corresponding parameters over the ROIs belonging to particular tissue types.
