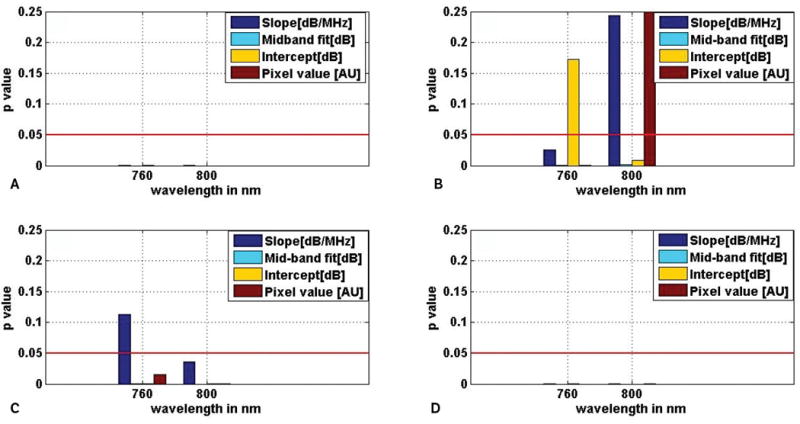
Figure 9.

Comparison of spectral parameters between different prostate tissue types: malignant versus normal (A), malignant versus BPH (B), BPH versus normal (C), and malignant versus nonmalignant (D), using a 2-sample, 2-tailed t test. The red lines show the levels corresponding to the decision criterion (P = .05).
