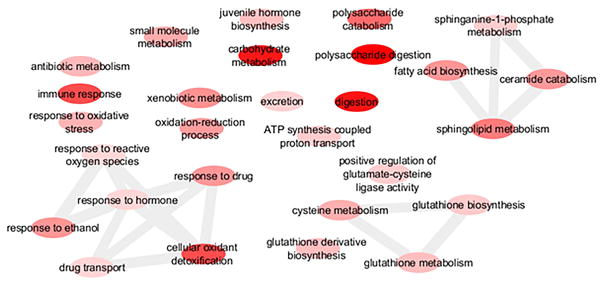
Fig. 1. GO term enrichment among the significantly up-regulated differentially expressed genes.
A sample of biological processes GO terms that were of relevance and significantly over-represented among the up-regulated genes were visualized using Revigo and Cytoscape. Each node represents a GO term. Darker colored nodes have lower p-values, and edges connect GO terms that have pairwise similarities that are in the strongest 3%. A full list of enriched biological processes GO terms is in Supplementary Table 3.

