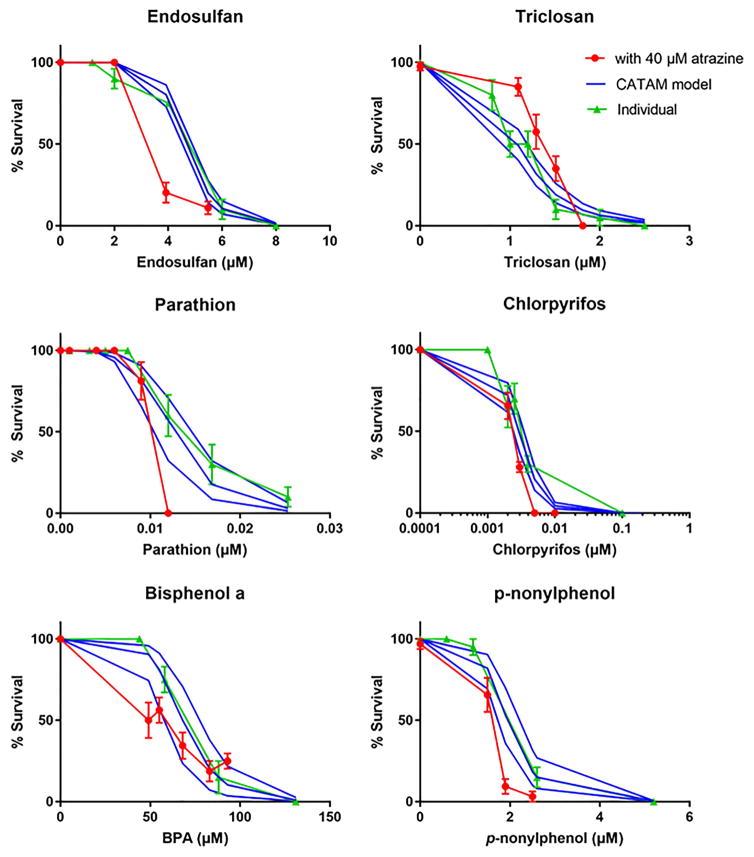
Fig. 4. Toxicity of individual chemicals and binary atrazine mixtures compared to the CATAM model.
Neonates were exposed to 40μM atrazine and one other chemical for 48 hours and survival measured. The measured toxicity of the individual chemicals and chemical mixture are compared to the estimated toxicity of the CATAM model. The CATAM model is shown as solid lines with the top and bottom lines indicative of the upper and lower 95% confidence intervals of the model based on the chemical’s Hillslope and LC50. Data are expressed as mean + SEM.

