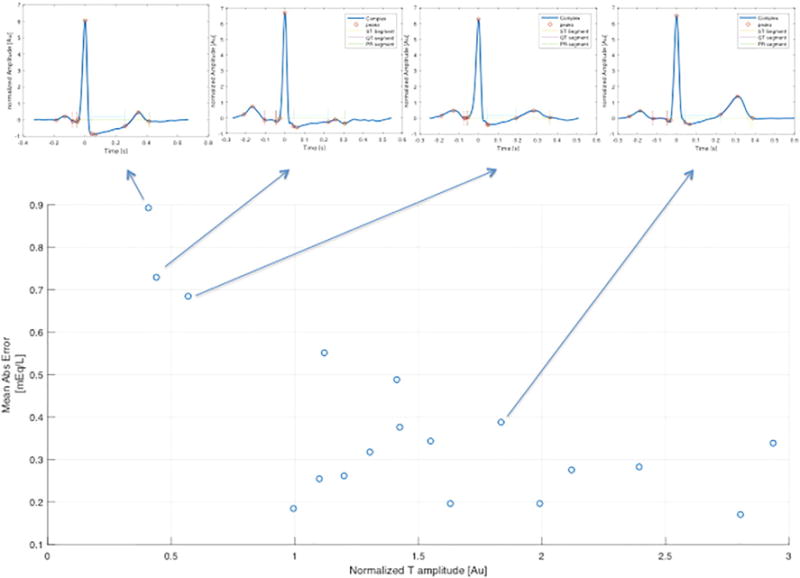
Fig. 3.

Association between T-wave amplitude and mean error. Scatter plot of T-wave amplitude on x-axis (energy normalized Max T amplitude in training) vs. the mean absolute error on y-axis (mean abs error). Arrows pointing to the corresponding averaged ECG signals visually demonstrate the T-wave morphology.
