
Figure 6.
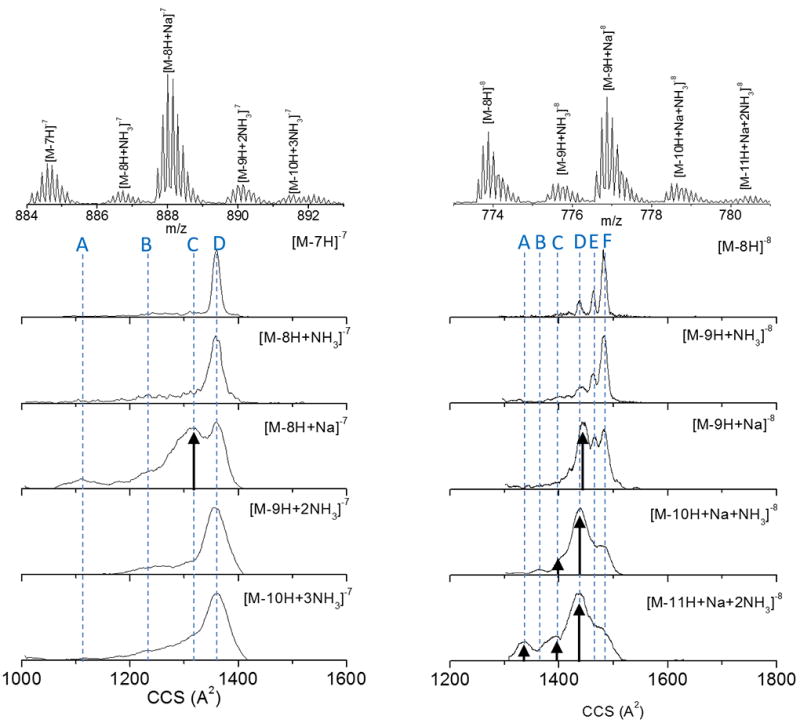
Typical mass spectra and mobility profiles for different i-motif DNA molecular ions observed at the z= −7 and z= −8 charge state. Notice the change in the mobility distribution in the presence of the ammonium and sodium adducts.
Official websites use .gov
A
.gov website belongs to an official
government organization in the United States.
Secure .gov websites use HTTPS
A lock (
) or https:// means you've safely
connected to the .gov website. Share sensitive
information only on official, secure websites.
Typical mass spectra and mobility profiles for different i-motif DNA molecular ions observed at the z= −7 and z= −8 charge state. Notice the change in the mobility distribution in the presence of the ammonium and sodium adducts.