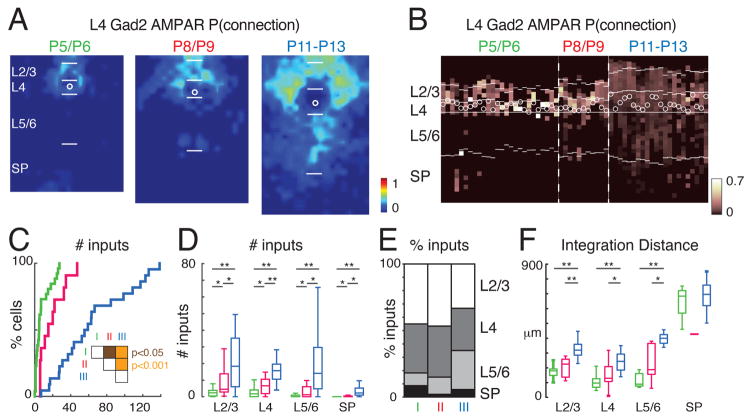
Figure 2. AMPAR-mediated cortical inputs to L4 Gad2 interneurons increase during development.
A: Map shows spatial connection probability of AMPAR-mediated inputs to layer 4 Gad2 interneurons during development (P5/P6, n = 26 cells; P8/P9 n = 11 cells; P11–P13 n = 22 cells). The input maps (Fig. 1E) of cells were aligned to the somata and averaged. The color scale indicates the fraction of cells that received an input from a particular spatial location. AMPAR-mediated inputs increase over development. The length of bars marking the layer boundaries is 100 μm. White circles indicates soma location. B: Laminar distribution of inputs for each cell. Plotted is the fraction of inputs each cell received at each laminar location. Soma location is indicated by white circles; cells are aligned to L4. Layer borders for each cell are indicated by white horizontal lines. Note that a subset of cells received AMPAR-mediated input from deep layers (including subplate, SP) at P5/6. C: Cumulative distribution function (CDF) of the number of input locations with AMPAR responses. The amount of inputs increased during development (median ± SD P5/6: 4.86 ± 8.6; P8/9: 15.14 ± 13.96; P11–13: 57.13 ± 39.58). Significance tests between groups indicated by inset. White: P > 0.05, brown: P < 0.05, orange: P < 0.001. D: Boxplots show the amount of inputs from each layer. Inputs from all layers increased over development. Significance tests between groups indicated by horizontal bars. * P < 0.05, ** P < 0.001. E: Average fraction of inputs from each layer. Initially cells received most input from L2/3 and L4. F: Plotted is the distance that 80% of inputs from each layer originate. * P < 0.05, ** P < 0.001. Average values can be found in Supplementary Table 1.

