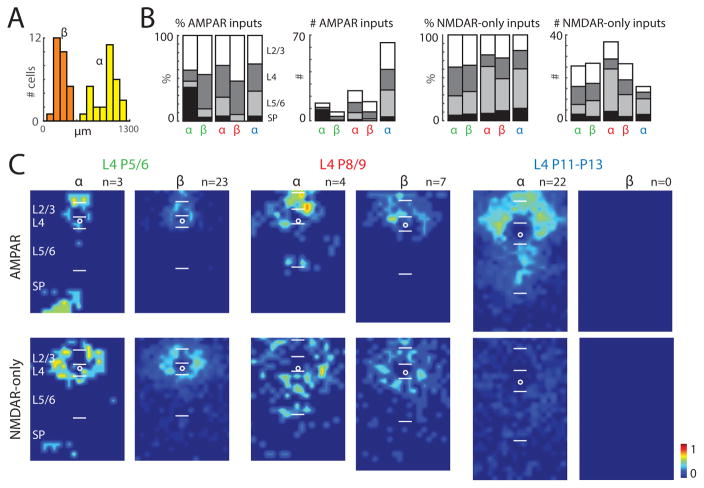
Figure 5. Two classes of GABAergic interneurons based on translaminar AMPAR-mediated inputs.
A: Results of K-means clustering based on the amount of AMPAR-mediated translaminar inputs for L4 Gad2 interneurons. Optimal cluster size of two was determined by silhouette criterion. Group α GABAergic interneurons integrate more translaminar inputs. B: Average fraction and average amount of inputs from each group for L4 GABAergic interneurons from different age groups. Green, P5/6; red, P8/9; blue, P11–P13. Left: AMPAR-mediated inputs, right: NMDAR-only inputs. Inputs from different layers were coded with different gray values. C: Average connection probability maps for L4 GABAergic interneurons in group α and β across ages. The color scale indicates the fraction of cells that received an AMPAR-mediated (top) or NMDAR-only input (bottom) from a particular spatial location. The length of bars marking the layer boundaries is 100 μm. White circles indicates soma location.

