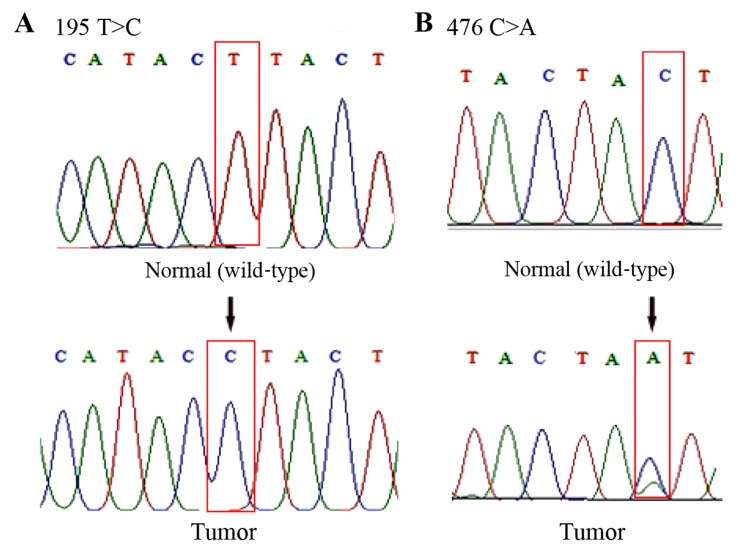
Figure 2.
Representative sequencing results depicting examples of mtDNA D-loop mutations in brain tumor tissue samples. (A) Chromatograms demonstrate a mutation of T to C transition at nucleotide position 195. (B) Novel heteroplasmic mutation of C to A transversion at nucleotide 476. In the tumor sample, there are two peaks that represent a mixture of C and A nucleotides. Mt, mitochondrial.

