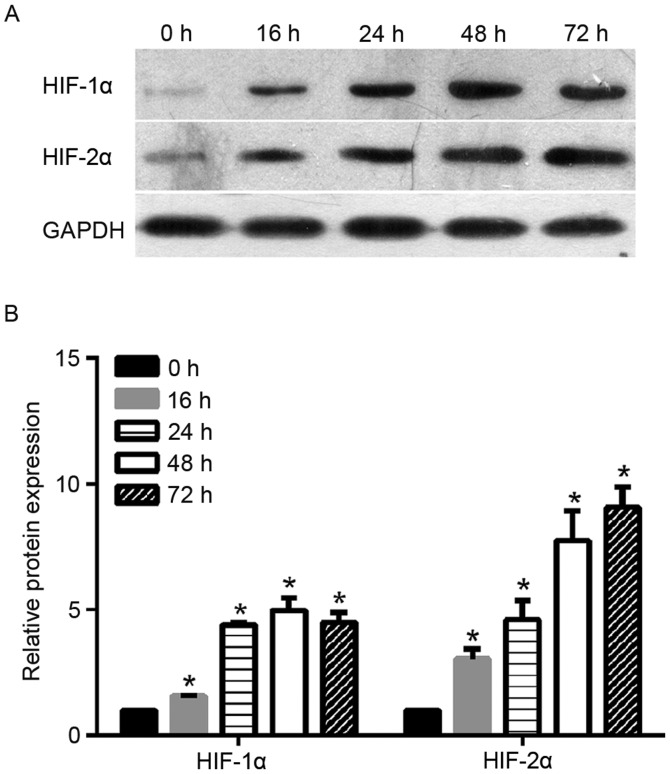
Figure 1.
Protein expression profile of HIF-1α and HIF-2α under hypoxia at different time-points. (A) Representative images of levels of HIF-1α and HIF-2α protein as detected by western blot analysis. (B) Quantification of the expression levels of HIF-1α and HIF-2α in each group, presented as bar graphs. Bars represent fold change. *P<0.05 vs. 0 h. HIF, hypoxia-inducible factor.

