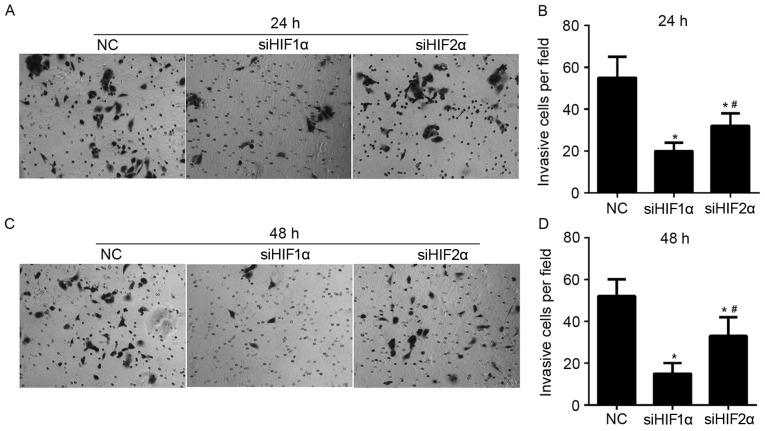
Figure 6.
Effect of HIF-1α and HIF-2α suppression on cell invasion in cervical cancer under hypoxic exposure. (A) Representative graph of Matrigel-Transwell results of CaSki cells in each treatment group under hypoxic exposure for 24 h. Magnification, ×200. (B) Quantification of invasive cells per field in each group under hypoxic exposure for 24 h, presented in bar graphs. (C) Representative graph of Matrigel-Transwell results of CaSki cells in each treatment group under hypoxic exposure for 48 h. Magnification, ×200. (D) Quantification of invasive cells per field in each group under hypoxic exposure for 48 h, presented in bar graphs. *P<0.05 vs. NC; #P<0.05 vs. siHIF2α group. HIF, hypoxia-inducible factor; NC, negative control; si, small-interfering.

