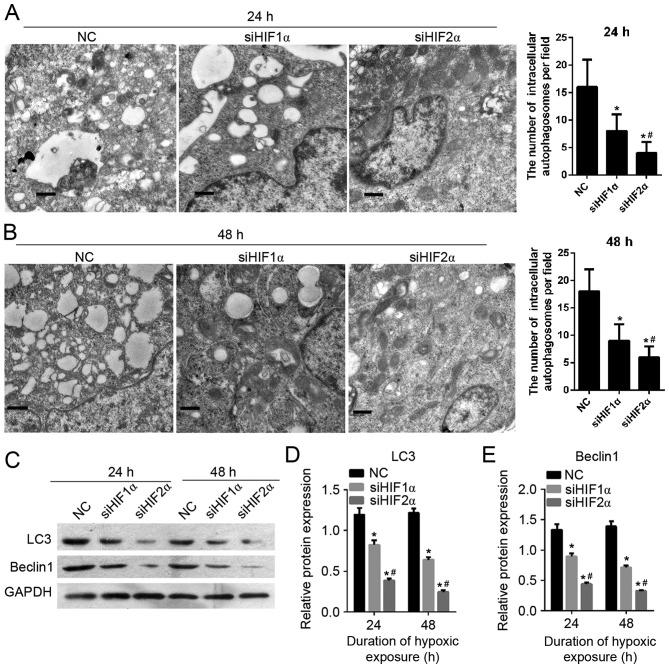
Figure 7.
Effect of HIF-1α and HIF-2α suppression on cell autophagy in cervical cancer cells under hypoxia. (A) Representative transmission electron microscope images (left) and statistical result of the number of intracellular autophagosomes per field (right) from each treatment group. The cells were cultured for 24 h under hypoxic exposure. Scale bar, 600 nm. (B) Representative transmission electron microscope images (left) and statistical result of the number of intracellular autophagosomes per field (right) from each group, where the cells were cultured for 48 h under hypoxic exposure. Scale bar, 600 nm. (C) Representative images of the level of protein expression of autophagy-related gene LC3 and beclin 1 as examined using western blotting. (D and E) Quantification of the expression levels of LC3 and beclin 1 in each group, presented in bar graphs as fold increase. *P<0.05 vs. NC; #P<0.05 vs. siHIF2α group. HIF, hypoxia-inducible factor; LC3, autophagy-related protein LC3; NC, negative control; si, small interfering.

