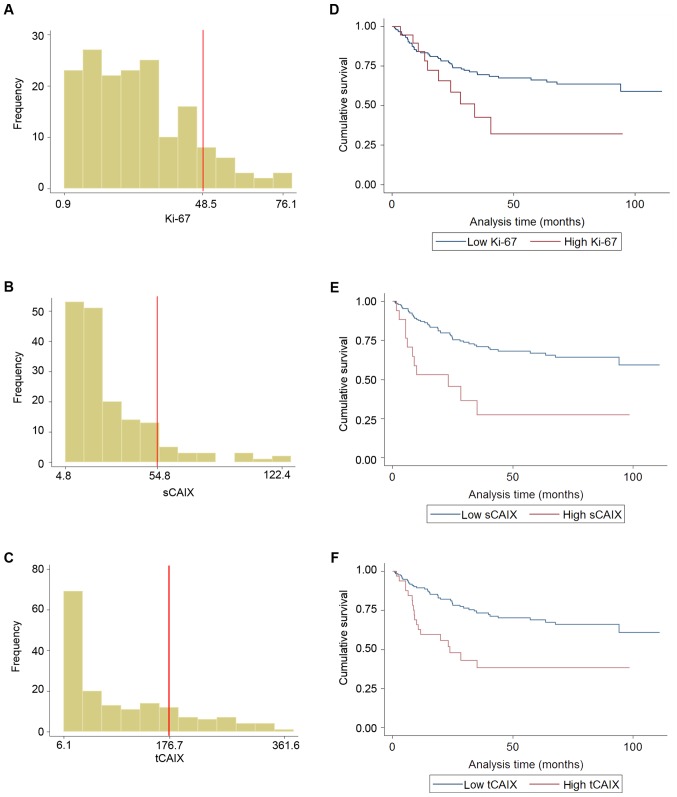
Figure 2.
Frequency distributions of AQUA® scores in OSCC patients and Kaplan-Meier survival curves according to the optimized AQUA® score cut-off points derived using X-Tile® software. (A) Frequency distribution histogram for Ki-67 AQUA® scores. (B) Frequency distribution histogram for sCAIX AQUA® scores. (C) Frequency distribution histogram for tCAIX AQUA® scores. (D) Kaplan-Meier survival curve according to optimized threshold value for Ki-67 AQUA® scores. (E) Kaplan-Meier survival curve according to optimized threshold value for sCAIX AQUA® scores. (F) Kaplan-Meier survival curve according to optimized threshold value for tCAIX AQUA® scores. OSCC, oral squamous cell carcinoma; AQUA, Automated Quantitative Analysis™; CAIX, carbonic anhydrase IX; t, tumoral, s, stromal.

