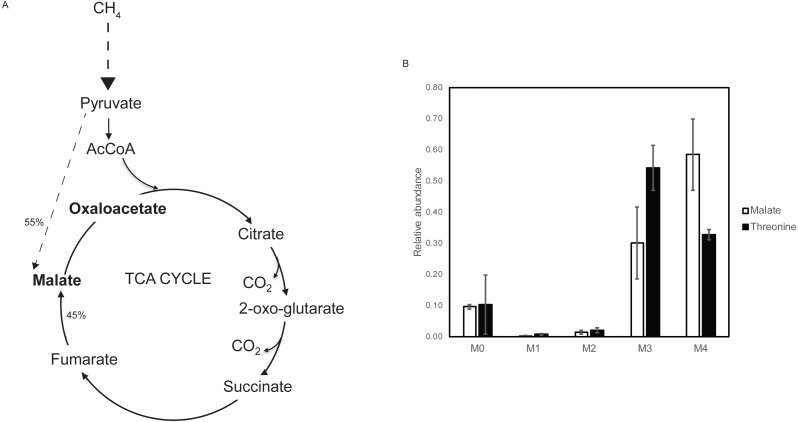
Figure 3. Steady state 13C tracer analysis of the aa3 cytochrome oxidase mutant strain.
(A) Metabolic subnetwork that could be deciphered using steady state 13C tracer analysis. Pathways with dashed line indicate multiple reactions combined into one reaction. Labeling pattern of metabolites in bold are measured using LC-MS/MS. TCA cycle contributes 45% of total influx into malate de novo synthesis, similar to WT. (B) Labeling patterns of malate and threonine (reflecting OAA) of the aa3 mutant strain showing different carboxylation signature.

