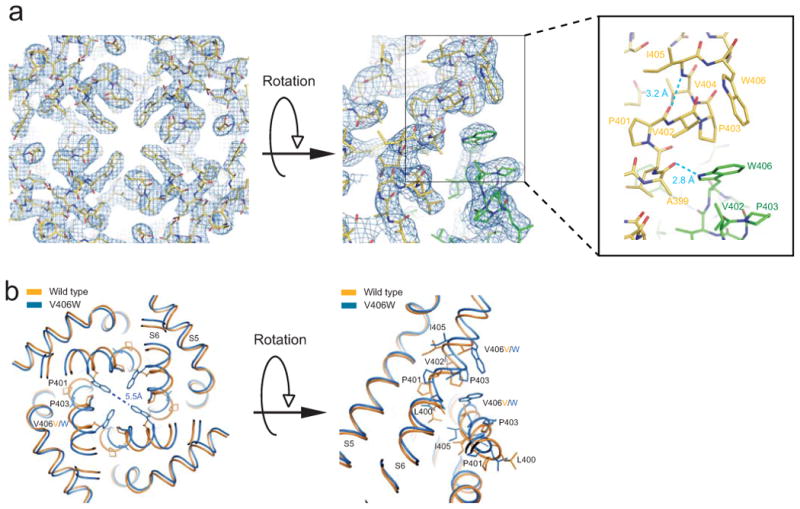
Figure 2.

Structure and electron density map of the region around residue 406 in mutant molecule I. (a) Crystal structure of S5 and S6 viewed from the inside of the cell, superimposed on the corresponding 2Fo-Fc composite-omit map generated with CNS and contoured at 1.5 σ. At right is a side view of two contiguous subunits (green and yellow). Dashed blue lines in the enlarged view of the boxed region suggest new hydrogen bonds as judged from distances. (b) Comparison of wild type (PDB: 2R9R; orange) and V406W mutant (blue) structures around residue 406; same views as in a.
