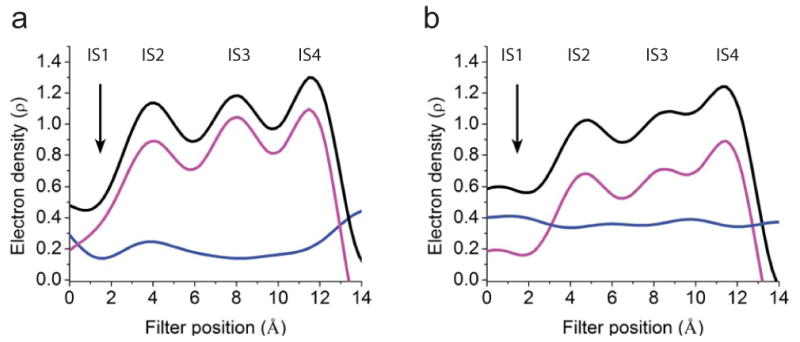
Figure 4.

One-dimensional electron density profiles (electrons/Å3) sampled from Fo-Fc maps along the central axis of the filter of V406W mutant molecule I. (a, b) The maps were calculated for four conditions: without (a) or with (b) the filter removed and without (magenta curve) or with (black curve) dummy ions added in the filter to prevent the bulk solvent correction. The blue curve in a or b represents the difference between the corresponding black and magenta curves. The origin of the horizontal axes corresponds to G374's Cα.
