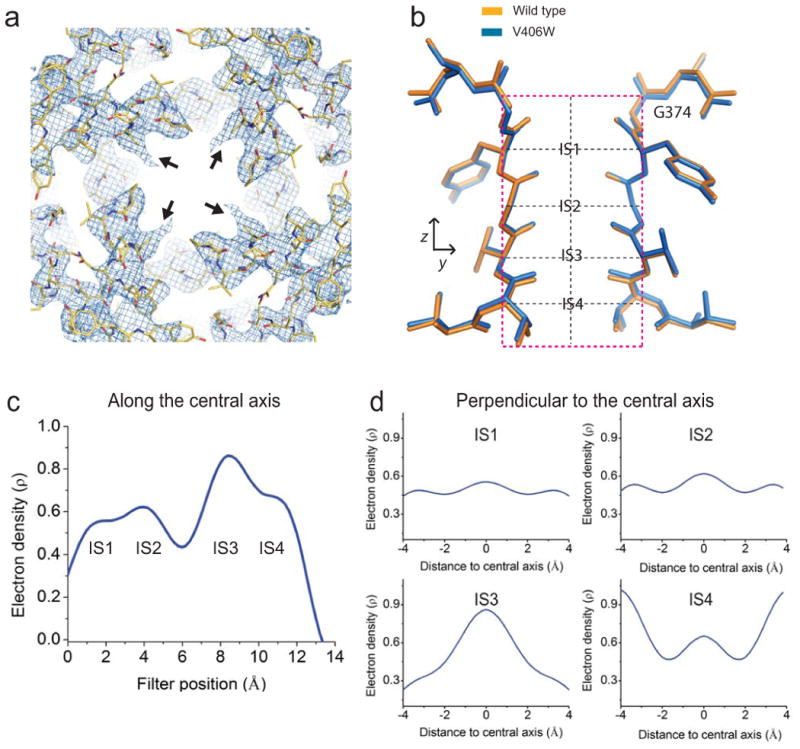
Figure 6.

Structure and density of V406W mutant molecule II. (a) Crystal structure of S5 and S6 of molecule II, viewed from inside the cell, superimposed on the corresponding 2Fo-Fc composite-omit map generated with CNS and contoured at 1.5 σ. All symmetric V406W side chains of molecule II were truncated at the Cβ atoms indicated by black arrows. (b) Selectivity filter of the V406W mutant (blue) superimposed on its wild-type counterpart (orange; PDB: 2R9R). (c,d) One-dimensional electron-density profiles (electrons/Å3) sampled from a filter-omitted Fo-Fc map along (c) and perpendicular to (d) the central axis at the levels of four individual K+ sites indicated by the vertical and four horizontal dashed black lines in panel b. Origin of the horizontal axis for panel c corresponds to G374's Cα; those for the plots in panel d are at the filter's central axis.
