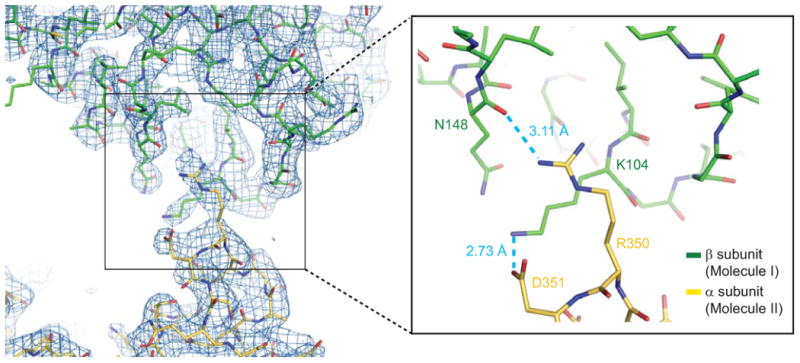
Figure 7.

Crystal contacts between the turret region of the α-subunit of molecule II and the β-subunit of molecule I. An interface region between molecule II's α-subunit (yellow; part of the turret region) and molecule I's β-subunit (carbon atoms in green), superimposed on the corresponding 2Fo-Fc composite-omit map contoured at 1.8 σ. Two pairs of atoms within hydrogen-bonding distance are identified by dashed blue lines in the enlarged view of the boxed region in the left panel.
