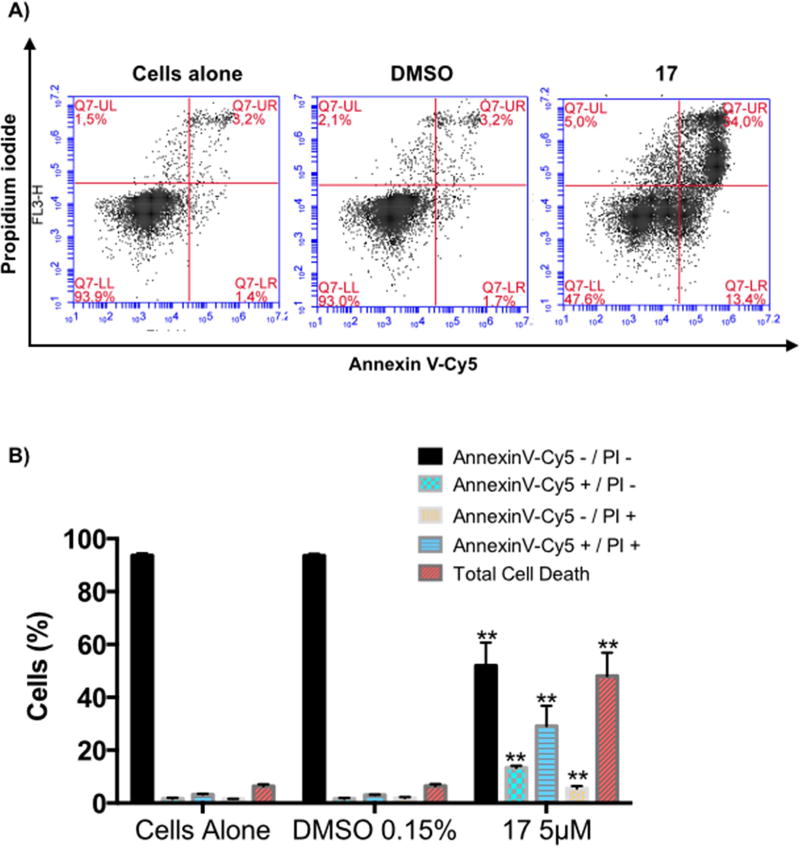
Figure 4.
Induction of H460 cell death by C17. Annexin V-Cy5/PI assay of H460 cells untreated, treated with vehicle, or treated with compound 17 at the indicated concentrations for 72h. A) Representative flow cytometric plots for the quantification of apoptosis are shown: the lower left quadrant (annexin V− and PI−) represents non-apoptotic cells, the lower right quadrant (annexin V+ and PI−) represents early apoptotic cells, the upper right quadrant (annexin V+ and PI+) represents the late apoptotic/necrotic cells, and the upper left quadrant (annexin V− and PI+) represents necrotic cells. B) The bar graph depicts the variation of the percentages of live, early apoptotic, late apoptotic cells, necrotic cells, and total cell death. Values represent the means ± SD of three independent experiments. p-Values obtained by comparing vehicle and treatment are presented as *<0.05, **<0.01.

