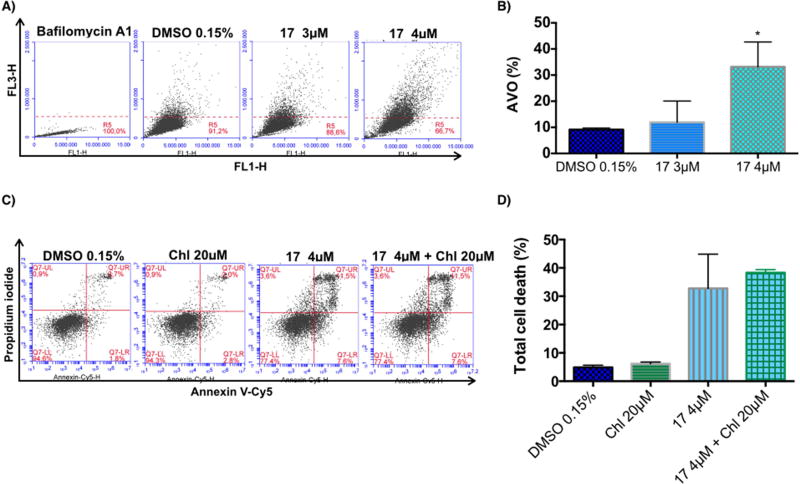
Figure 6.
Effect of C17 treatment on induction of autophagy in the H460 cell line and the effect of its inhibition. A) The formation of acidic vascular organelles (AVO) was measured by acridine orange staining and flow cytometry. Representative flow cytometric plots of the percentage of AVO formation (acridine orange staining positive) of three independent experiments are shown. B) The graph bar depicts the variation of the percentage of AVO formation (acridine orange staining) and is plotted as means ± SD of three independent experiments. p-Values obtained by comparing vehicle and treatment are presented as *<0.05. C) Annexin V-Cy5/PI assay of H460 cells treated with vehicle, 20 µ M chloroquine (Chl), 4 µM compound 17, or the combination of chloroquine and C17, at the indicated concentrations for 72h. Representative flow cytometric plots for the quantification of apoptosis are shown. D) The bar graph depicts the variation of the percentage total cell death. No statistical difference was observed comparing cells treated with C17 alone or in combination with chloroquine. Values represent the means ± SD of three independent experiments.

