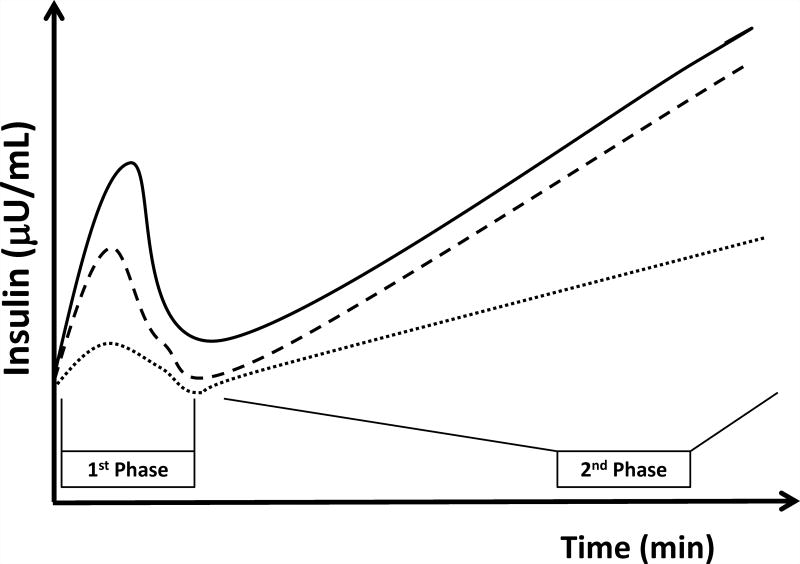
Figure 1. Insulin secretion during a hyperglycemic clamp in obese youth.
Those with NGT (solid line) show normal first and second phase insulin secretion. Those with IGT (dashed loine) show reduced first phase along with preserved second phase insulin secretion. Those with T2DM (dotted line) show defects in both first and second phase insulin secretion.

