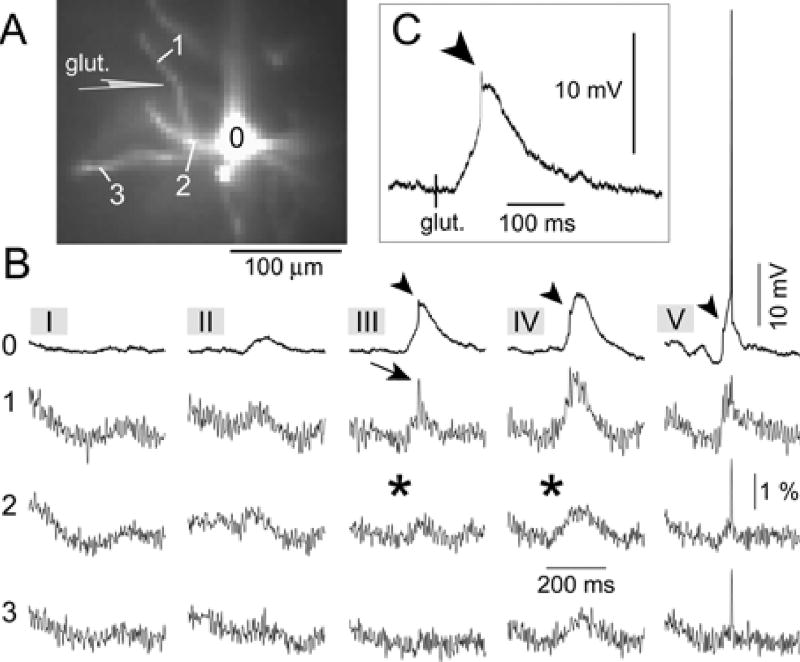
Fig. 6. Initiation of basal spikelets at near threshold glutamate concentrations.
(A) Fluorescence image obtained with the data acquisition camera. The schematic drawing indicates the position of the glutamate-filled sharp pipette. (B) Intensity of glutamate iontophoretic current was gradually increased in five steps (five sweeps I – V) from 0.8 to 1.2 µA. Optical signal from the non-target dendrite (ROI 3) is aligned with optical signals from the target dendrite (ROIs 1 & 2) and whole cell recording from the soma (ROI 0), for each stimulus intensity (I–V). Arrowhead, fast prepotential in somatic recording. Arrow, basal spikelet in dendritic optical recording. Asterisk, absence of any fast transient. (C) The same as in B III ROI 0, shown here on a faster time base.

