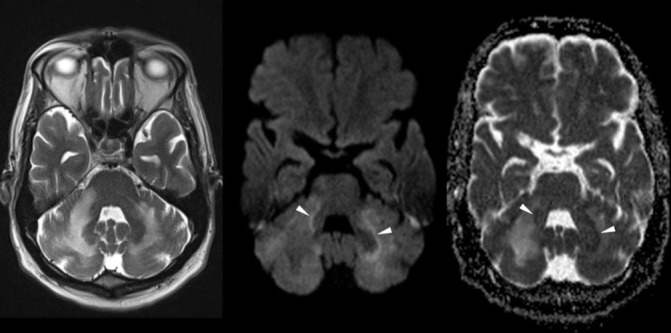
Figure 1.

Follow-up MRI of the brain. Transverse T2-weighted image, diffusion-weighted image (DWI) and corresponding apparent diffusion coefficient (ADC) map (left to right). Transverse T2-weighted image of the posterior fossa shows confluent hyperintense white matter changes in both cerebellar hemispheres. On the right more than left side, there is extension through the middle cerebellar peduncle into the brainstem. DWI depicts high signal in the periphery of the white matter lesions left more than right (arrowheads) with corresponding low signal on the ADC map (arrowheads), consistent with restricted diffusion. There was no contrast enhancement (not shown).
