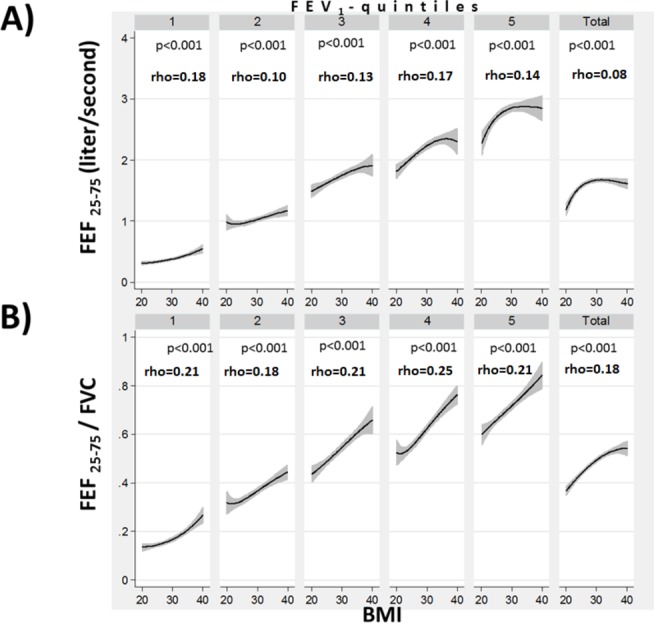
Figure 3.

The relationship between body mass index (BMI) and forced expiratory flow (25-75) (FEF25–75) (A) and (FEF25–75)divided by forced vital capacity (FVC) (B), stratified by forced expiratory volume in 1 s (FEV1) quintiles and for the entire study population (BMI 20–40). Spearman’ s rank correlation coefficients (Spearman’s rho) are shown and significance of the correlation is indicated by the corresponding p value.
