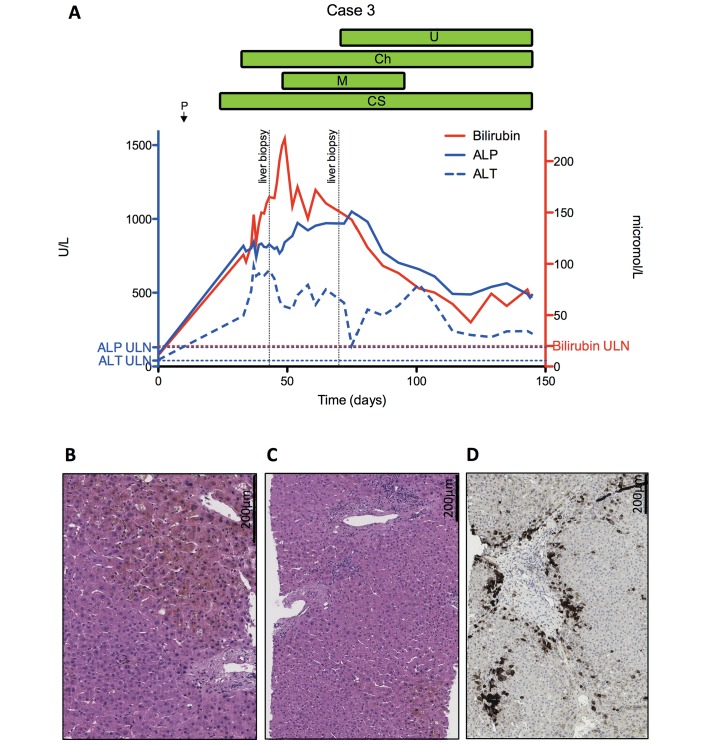
Figure 3.
(A) Graph showing the changes in liver function tests over time for case 3, with a summary of systemic treatments given over time. The right y-axis refers to bilirubin levels, the left y-axis refers to ALP and ALT levels. (B) Photomicrograph of a representative H&E section from the first liver biopsy in case 3. This section shows a portal tract with an attenuated bile ductule at the periphery of a tract, along with a naked arteriole. The parenchyma shows severe cellular and canalicular cholestasis. (C) Photomicrograph of a representative H&E section from the first liver biopsy in case 3, further demonstrating the marked degree of duct irregularity and degenerative change with focal ductular reaction and cholestasis towards the edge of the image. (D) Photomicrograph showing cytokeratin 7 immunohistochemistry of a representative section from the first liver biopsy in case 3. This shows prominent intermediate hepatobiliary phenotype consistent with the degree of duct injury and ductopaenia. ALP, alkaline phosphatase; ALT, alanine aminotransferase; Ch, cholestyramine; CS, corticosteroids; M, mycophenolate mofetil; U, ursodeoxycholic acid; ULN, upper limit of normal.

