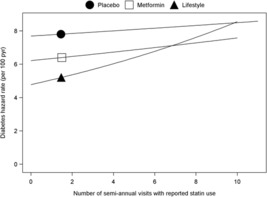
Figure 2.

Diabetes hazard rates by number of visits with reported statin use. The risk of developing diabetes associated with the duration of exposure to statin therapy estimated using Cox proportional hazards models. The symbol on each line indicates the expected hazard rate for a subject with a number of visits with reported statin therapy equal to the mean value for the group over the group-specific range (5th–95th percentile). The risk for progression to diabetes by number of visits with reported statin use was calculated for each treatment group with model 5 from table 2. The number of semiannual visits with reported statin use significantly predicted progression to diabetes only in the lifestyle group (p=0.007); this relationship was not significantly different across the three groups (heterogeneity p=0.26).
