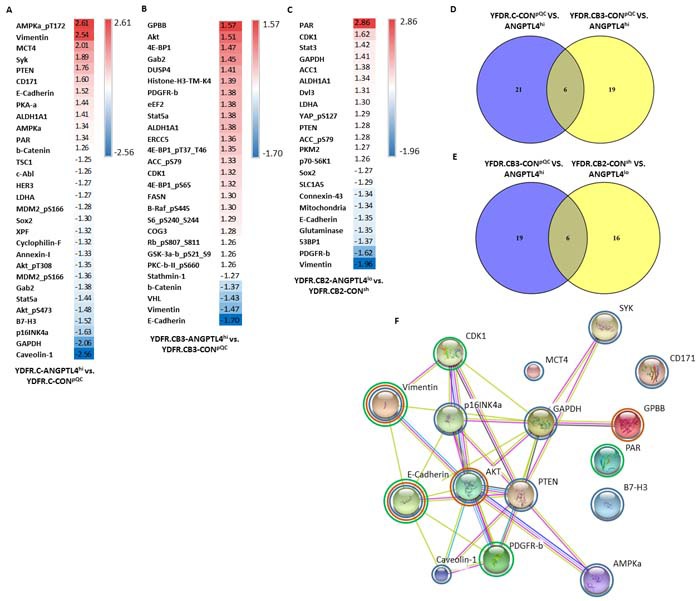
Figure 5. Proteomic expression analysis of ANGPTL4 high and low expressing cells.

The expression of 305 proteins was examined using RPPA analysis in the ANGPTL4hi and ANGPTL4lo cells vs. their corresponding control cells. A., B., C. Comparisons were done for each pair of cells: (A) cutaneous ANGPTL4hi vs. CONpQC cells, (B) brain metastasizing ANGPTL4hi vs. CONpQC cells and (C) brain metastasizing ANGPTL4lo vs. CONsh cells. The tables show the normalized expression of differentially expressed proteins with FC < -1.25 or FC>1.25. D., E. Venn diagrams were used to compare lists of differentially expressed proteins. (D) Proteins differentially expressed in both comparisons obtained in (A) and (B). (E) Proteins differentially expressed in both comparisons obtained in (B) and (C). F. Protein-protein interactions of differentially expressed proteins with FC < -1.5 or FC>1.5 from all three comparisons. Circled in blue are proteins from comparison (A), circled in orange are proteins from comparison (B), and circled in green are proteins from comparison (C).
