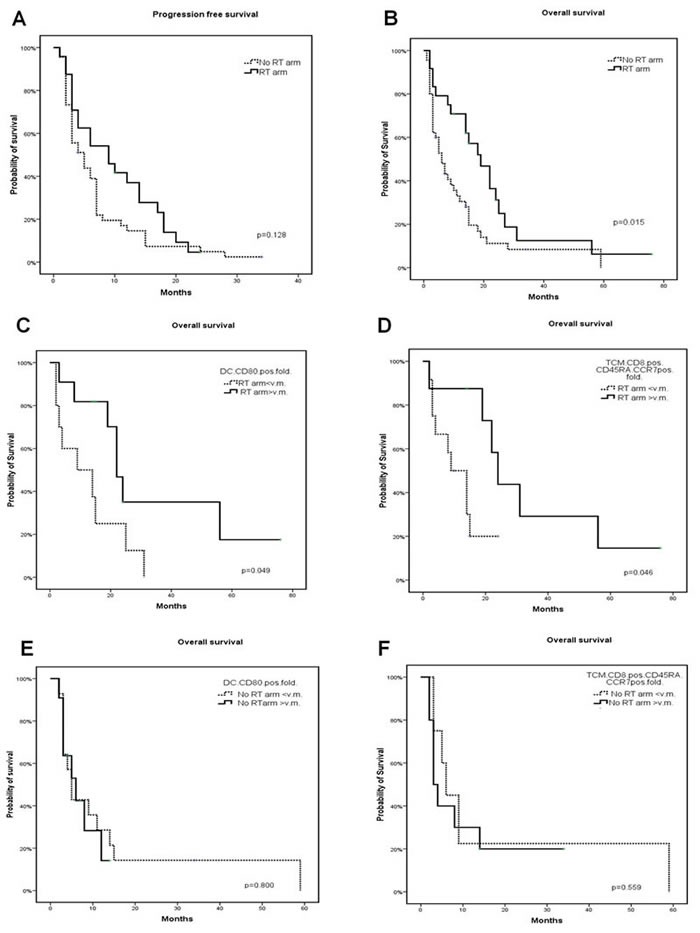
Figure 1. Representation of PFS and OS of patients.

PFS A. and OS B. of patients undergone mCH and mCH + RT. Figure also represents OS of patients undergone mCH C., D. and mCH + RT E., F. with fold to baseline value of activated dendritic cells C. and E. and central memory T cells D. and F. ≤ 1 or > 1. The percentage of activated dendritic cells and central memory T cells was evaluated on the PBMCs isolated from patients at baseline and after four mCH courses, by performing a multicolor immune-cytoflurimetric analysis, as described in a previous study on the same patients.
