
Figure 5. MO-OH-Nap and SAHA induce distinct patterns of gene expression.
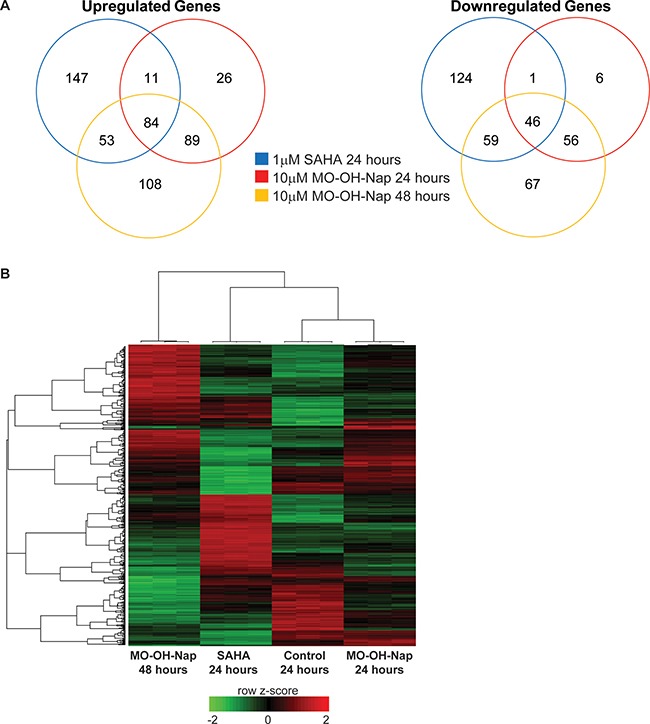
(A) Venn diagrams showing overlaps in gene expression for upregulated and downregulated genes in SAHA-24 hour (blue), MO-OH-Nap-24 hour (red) and MO-OH-Nap-48 hour (yellow) treated cells relative to the untreated control. (B) Heatmap of differentially expressed in the four treatment groups. Unsupervised hierarchical clustering is shown for individual genes (left) and samples (top). The color key shows row z-scores in which red denotes highly expressed genes and green denotes lowly expressed genes.