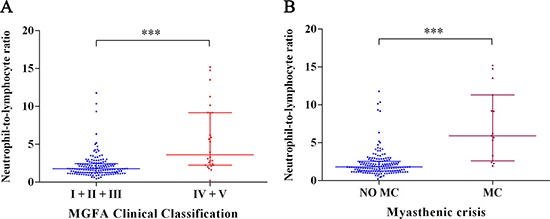
Figure 1. Correlation between NLR and other clinical factors in MG patients.

(A)Relationship between NLR and two subgroups according to the MGFA Clinical Classification (***P < 0.001). (B) Relationship between NLR and MC (***P < 0.001). Bar represents median and interquartile range.
