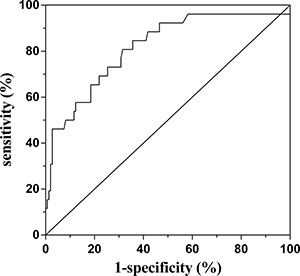
Figure 3. Receiver operating characteristic (ROC) curve analysis of the predictive power of the NLR for higher disease activity of MG.

The area under ROC curve: 0.816; 95% CI: 0.722–0.910; P < 0.001.

The area under ROC curve: 0.816; 95% CI: 0.722–0.910; P < 0.001.