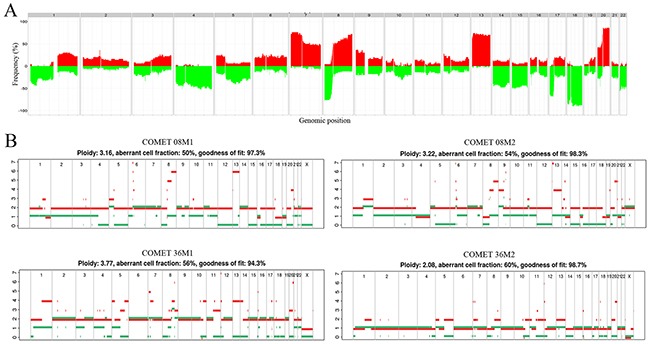
Figure 2. Genome wide copy number alterations.

(A) Frequency plot of genome wide copy number alterations. The histogram shows percentage of samples with specific alterations. The genomic position is indicated by chromosome 1 on the left and up to chromosome 22 on the right. Copy number gains for each region are depicted in red, and copy number losses are depicted in green. The plot shows high frequency of CNAs in chromosomes 7, 8, 13, 18 and 20. (B) Metastatic pairs displaying discrepancies in copy number profiles. Estimated ploidy and purity (tumor cell fraction) values are listed at the top of the plot. Metastatic pair 8M1 and 8M2 show discrepancies in segments of chromosomes 4, 13 and 14; metastatic pair 36M1 and 36M2 differ in total ploidy, with 36M1 having ploidy close to 4n and 36M2 having ploidy close to 2n.
