
Figure 3. Gene expression variability in tumor-adjacent liver samples and metastases.
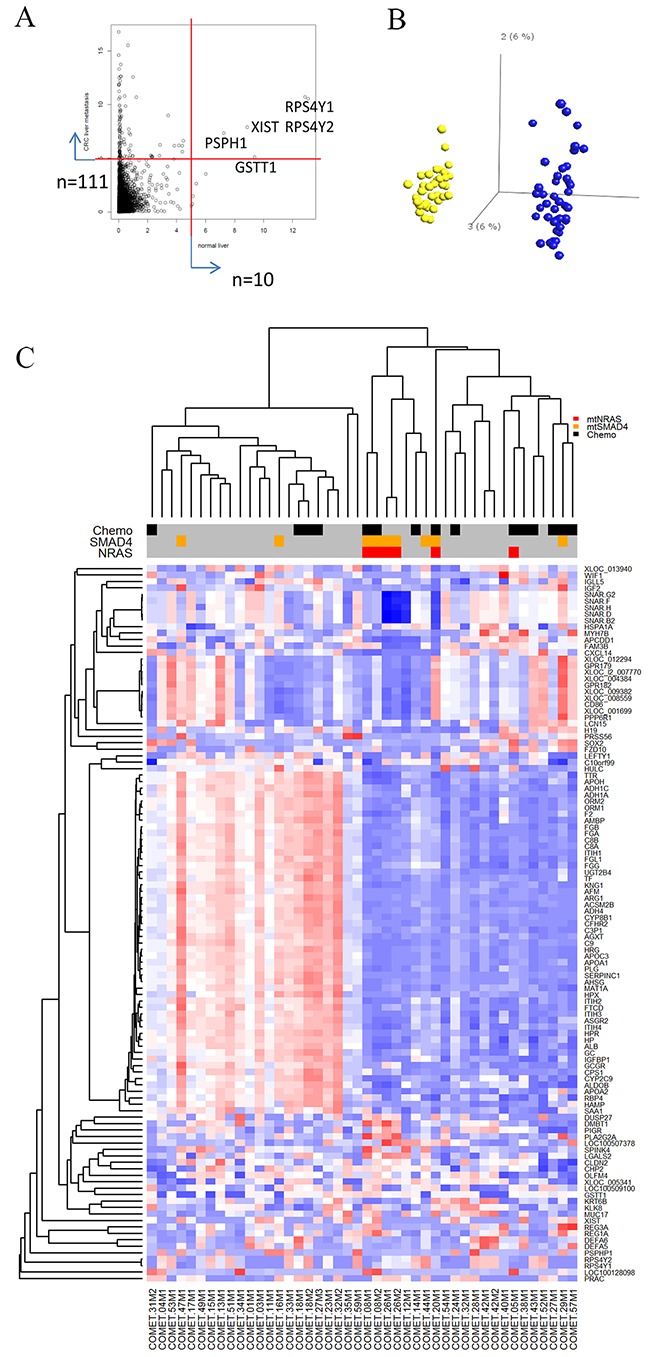
(A) Dot-plot showing distribution of variability of individual transcripts in tumor-adjacent liver samples (x-axis) and metastases (y-axis). Ten genes in tumor-adjacent liver samples and 111 genes in metastases were identified by a variance filter of the respective gene expression data sets (variance>5). (B) Principle component analysis comparing gene expression from tumor-adjacent liver samples (yellow dots) compared to metastases (blue dots). The two sample types formed distinct non-overlapping clusters. (C) Heat map representing the expression profiles of the 111 genes found to be highly variable in metastases and subjected to unsupervised clustering analysis. Red-blue scale: red represents high expression and blue low expression. Annotation of samples includes administration of neoadjuvant chemotherapy (NACT) and mutations in SMAD4 and NRAS.