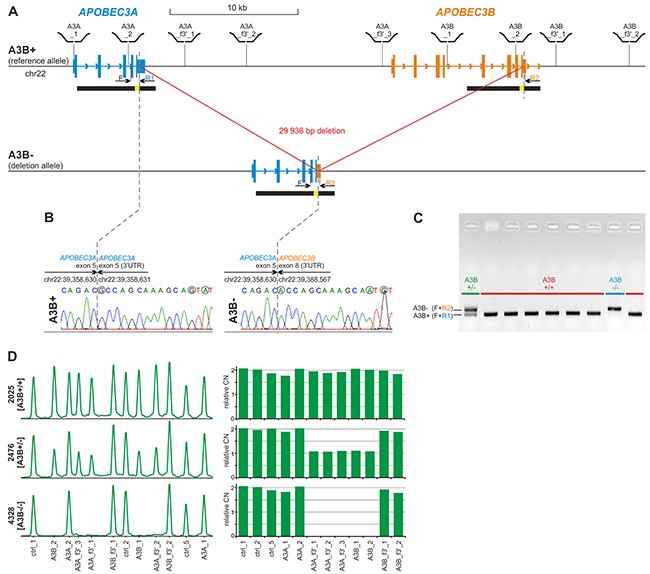
Figure 1. Structure of the APOBEC3B deletion and design of the PCR-based and MLPA-based genotyping assays.

(A) Structure of A3B+ and A3B- alleles. Blue and orange vertical rectangles indicate exons of APOBEC3A and APOBEC3B, respectively. Higher and lower rectangles indicate coding and UTR sequences, respectively. Arrowheads along intron lines indicate the direction of the genes. Black horizontal bars under the gene schemes indicate highly homologous (~95%) segmentally duplicated regions, with a yellow inset indicating 350 bp redundant fragment of 100% homology. Positions of MLPA probes used for A3Bdel_MLPA assay are schematically depicted above the region map; positions of F, R1 and R2 primers used for sequencing and in A3Bdel_PCR assay are indicated under the map. (B) Results of Sanger sequencing of deletion breakpoints amplified with the F-R1 (left-hand side) and F-R2 (right-hand side) pairs of primers, respectively. Dotted lines indicate exact breakpoint positions according to HGVS recommendation (after the last nucleotide of the redundant sequence). Sequencing was performed using homozygous A3B+/+ and A3B-/- samples. Nucleotides that distinguish the A3B+ and A3B- alleles are circled in gray. (C) Visualization (agarose gel with EtBr staining) of PCR products of the A3Bdel_PCR assay. A3B+/+ genotypes without deletion; A3B-/- genotype with homozygous deletion; A3B+/- genotype with heterozygous deletion. (D) Exemplary results of the A3Bdel_MLPA analysis. The left-hand side panel: the MLPA electropherograms of the representative samples with A3B+/+, A3B+/-, and A3B-/- genotypes. The probe IDs are shown under the electropherograms. The right-hand side panel: bar plots (corresponding to the electropherograms shown on left-hand side) representing the normalized copy number value (y-axis) of each probe (x-axis).
