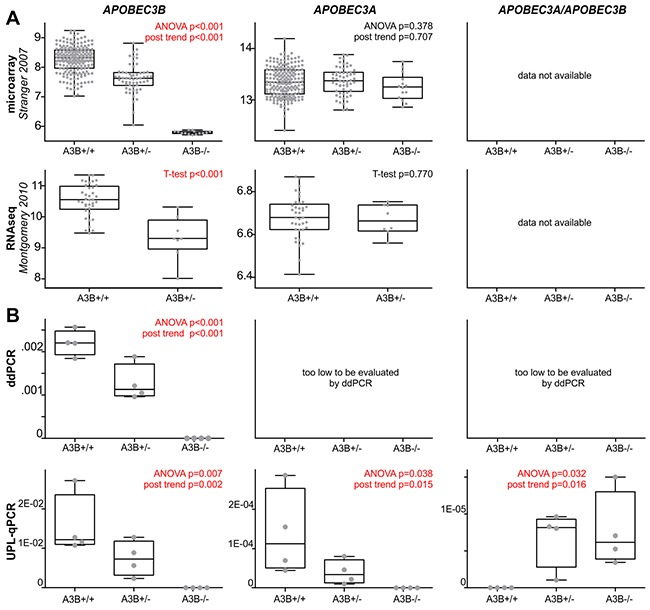
Figure 2. Effect of the APOBEC3B deletion on the expression of the affected genes, i.e., APOBEC3B, APOBEC3A, and APOBEC3A/APOBEC3B.

(A) Comparison of the APOBEC3B deletion genotypes (A3B+/+, A3B+/-, A3B-/-; x-axes) in HapMap samples with relative expression (y-axes) level of the affected genes (indicated above) retrieved from microarray (upper row, [69]) and RNAseq (lower row, [70]) whole genome mRNA profiling datasets. It has to be noted that panel of HapMap samples analyzed in RNAseq study did not comprise samples with A3B-/- genotype. (B) Experimental analysis of expression of the affected genes in 12 HapMap cell lines with A3B+/+ (n=4), A3B+/- (n=4) and A3B-/- (n=4). The expression analysis was performed with ddPCR (upper row) and UPL-qPCR (lower row). Note that due to very low levels of APOBEC3A and APOBEC3A/APOBEC3B expression (>>1000 lower than APOBEC3B), they could not be reliably evaluated with ddPCR. The box-and-whisker plots summarize the distribution of the relative expression data points determined by microarray, RNAseq, ddPCR, and UPL-qPCR. The band inside of each box represents the median, and the upper and lower edges of the box represent 1st and 3rd quartile of distribution. Whiskers indicate the lowest and the highest observed values.
