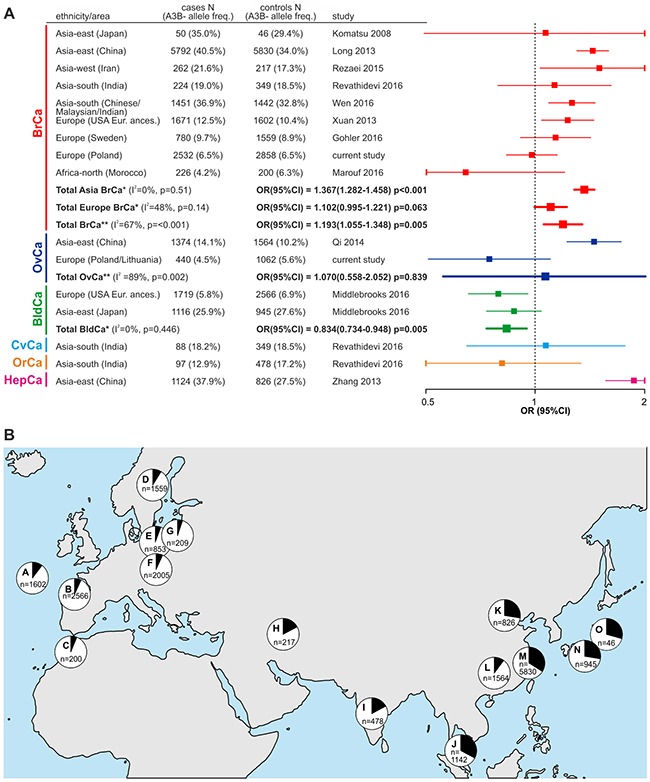
Figure 3. Meta-analysis of association studies of the APOBEC3B deletion with breast and other types of cancer.

(A) Forest plot summarizing results of the meta-analysis. Characteristics of the studies used in the meta-analysis are shown on the left side of the plot. The plot illustrates the measure of the effect of the APOBEC3B deletion on predisposition to particular cancer types, i.e., OR (square) with the corresponding 95% CI (horizontal lines), observed in different studies enrolled in the meta-analysis. The meta-analysis was performed under the dominant model of inheritance (A3B+/+ and A3B+/- vs. A3B-/-). Weighted odds ratios with the corresponding 95%Cis (squares with horizontal lines in bold) were obtained using Mantel-Haenszel method under fixed* or random** effects models, depending on results of heterogeneity tests (p>0.10 for the Q test and I<50% were considered to indicate a lack of significant heterogeneity). The vertical dotted line indicates no effect (OR=1) of the APOBEC3B deletion on cancer predisposition. The OR values are plotted on a logarithmic scale to obtain symmetrical CIs and equivalent visualization of ORs of values greater and lower than 1. Horizontal lines corresponding to CIs that are out of range of 0.5-2 have been cut (vertical line) for visualization purposes. BrCa - breast cancer; OvCa - ovarian cancer; BldCa - bladder cancer; CvCa - cervical cancer; OrCa - oral cancer; HepCa - hepatocellular cancer. (B) Worldwide distribution of the allelic frequencies (black segments in pie charts) of the APOBEC3B deletion in control groups used in studies that were enrolled in the meta-analysis. Each letter indicates particular geographic region/population from a particular study, i.e., A - USA European ancestry [31]; B - Spain/USA European ancestry [41]; C - Morocco [39]; D - Sweden [37]; E - Poland (GDANSK) (current study); F - Poland (SZCZECIN) (current study); G - Lithuania (VILNIUS) (current study); H - Iran [36]; I - India [38]; J - Malaysia [40]; K - China [32]; L - China [34]; M - China [17]; N - Japan [41]; O - Japan [25]. “n” indicates the number of samples in the control groups in each study.
