
Figure 2. Comparison for the reproductions of four hexon-chimeric oncolytic adenovirus (P9, P9-4C, GP and Ad) in BJ cells, GPFs and gastric CAFs.
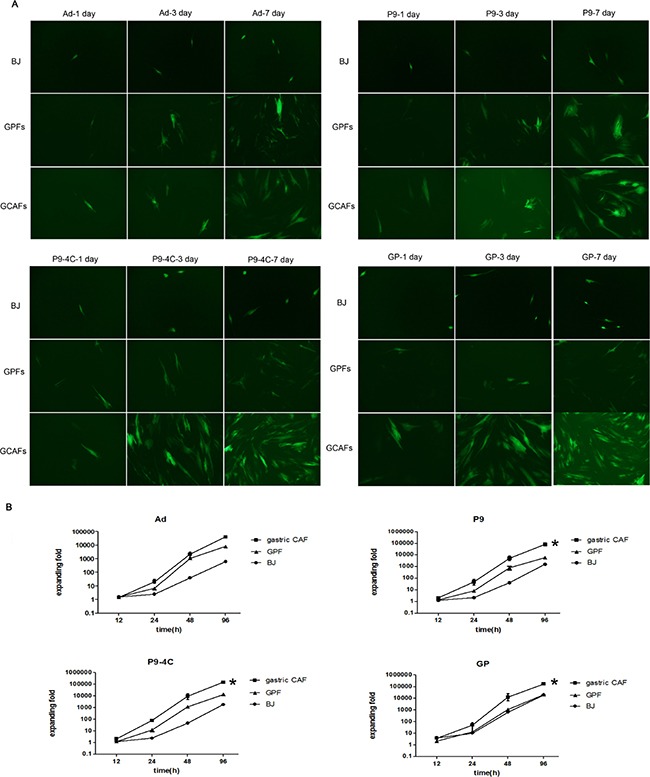
(A) The fluorescent images of the EGFP expression at 1, 3 and 7 days after the infection (MOI = 5). (B) The reproduction fold changes at 0, 12, 24, 48 and 96 h after the infection (MOI = 5). *, VS. GPFs, p < 0.05.