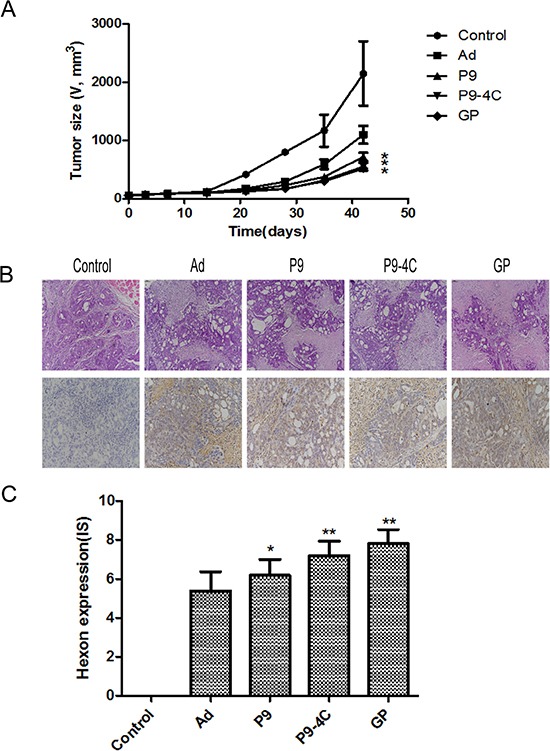
Figure 5. Compares for the effect of four hexon-chimeric oncolytic adenovirus (P9, P9-4C, GP and Ad) on transplantation tumor mice model of GC.

(A) The tumor growth curves in P9, P9-4C and GP groups. (B) The typical tumor tissue morphology by HE staining and the hexon protein expression by immunohistochemistry in P9, P9-4C and GP groups. (C) Compare of the IS for the expression of Hexon in tumor tissues in P9, P9-4C and GP groups. *VS. Ad group, p < 0.05. **VS. Ad group, p < 0.01.
