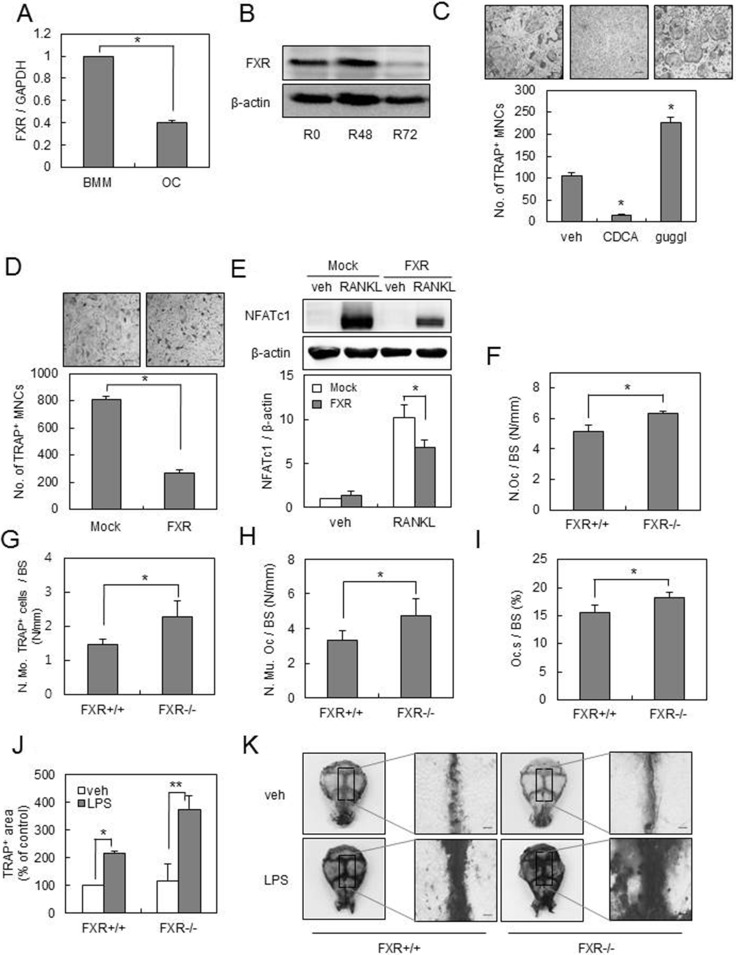
Figure 1. FXR negatively regulates osteoclast formation.
(A) BMMs from 12-week-old mice were cultured with RANKL (100 ng/ml) and M-CSF (30 ng/ml) for 4 days. The mRNA levels of FXR were analyzed by real-time PCR. (B) BMMs from 12-week-old mice were cultured with RANKL (100 ng/ml) for the indicated times and FXR expression levels were analyzed by western blot. (C) BMMs were cultured with RANKL (100 ng/ml) and M-CSF (30 ng/ml) in the presence of 75 μM CDCA or 0.3 μM guggulsterone for 4 days. TRAP+ MNCs were counted as osteoclasts when more than 3 nuclei were present. Scale bar, 200 μm. (D) BMMs were infected by mock or FXR through a retrovirus packaging system. Infected BMMs were cultured with RANKL (100 ng/ml) and M-CSF (30 ng/ml) for 4 days. Scale bar, 200 μm. (E) Infected BMMs were cultured with M-CSF (30 ng/ml) in the presence or absence of RANKL (200 ng/ml) for 48 h. Cell lysates were then subjected to western blot analysis with anti-NFATc1 antibody. (F–I) Histological bone sections from distal femur of FXR+/+ and FXR−/−mice were analyzed. N.Oc./BS (F), N.Mo. TRAP+ cells/BS (G), N.Mu.Oc/BS (H) and Oc.S/BS (I). n = 6 for each group. (J–K) Calvarias of FXR+/+ and FXR−/− mice that received the vehicle or LPS were subjected to TRAP staining. TRAP+ stained area in calvaria was quantified using ImageJ. Representative images are shown in (K). n = 5 for each group. Scale bar, 500 μm. *p < 0.05, **p < 0.01. N.Oc./BS: osteoclast number/bone surface; N.Mo.TRAP+ cells/BS: number of TRAP+ mononuclear cells/bone surface; N.Mu.Oc/BS: number of multinuclear osteoclast/bone surface; Oc.S/BS: osteoclast surface/bone surface.

